Posts

Showing posts from May, 2022

2022: Week 21 - Solution

Image
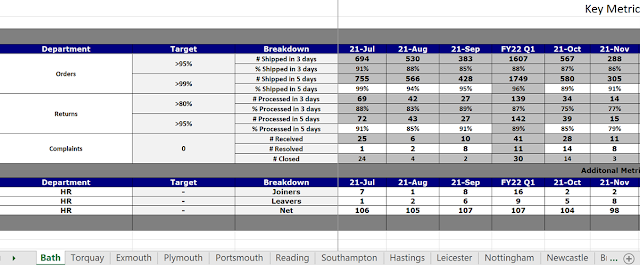
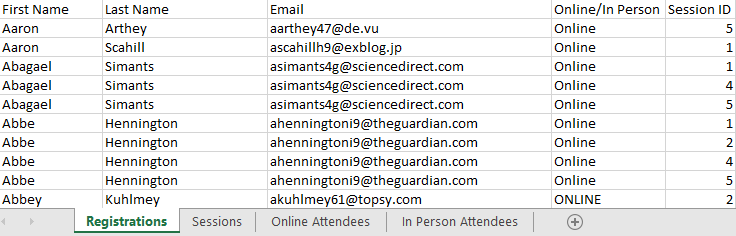
Solution by Tom Prowse and you can download the workflow here .  The challenge this week focussed on a real world data structure that needed some cleaning in Tableau Prep so that we could easily visualise the data within Tableau Desktop. There are lots of sheets and some key metrics that we want to focus on... let's see how we completed it! Step 1 - Input Sheets The first task is to input all of the different sheets which are based on the different stores. After connecting to the Input file, we then need to use the Data Interpreter to clean the sheets so the table is easier for us to work with. The Data Interpreter will split the sheets into two tables, Key Metrics and Additional Metrics - we want to just focus on the Key Metrics. As we are using the Data Interpreter, we can't use the Wildcard union, therefore we need to input all of the tables (with A4:T15) in the title, until we have all of the stores in a single table. The workflow will look something like this:  As a result

2022: Week 21 - Multi-sheets of Madness

Image
 Challenge by: Jenny Martin We're returning to Chin & Beard Suds Co for this week's challenge. It's inspired by a real data structure, which needed some cleaning before connecting to Tableau Desktop.  Inputs There are 12 sheets from different shops reporting the Key Metrics that we are interested in. There are Additional Metrics in a table below that are not of interest to us for this challenge.  Requirements Connect to the data Bring together the Key Metrics tables from each Shop You'll notice that we have fields which report the quarter in addition to the monthly values. We only wish to keep the monthly values Reshape the data so that we have a Date field For Orders and Returns, we are only interested in reporting % values, whilst for Complaints we are only interested in the # Received We wish to update the Breakdown field to include the Department to make the Measure Name easier to interpret We wish to have a field for each of the measures rather than a row per m

2022: Week 20 - Solution

Image
Solution by Tom Prowse and you can download the workflow here .  The challenge this week had a Tableau Conference theme, and focussed on session attendance in the hybrid world of the virtual and in-person conference. We wanted to see who were unable to join a session that they had registered for at the conference. All data is mocked up! Step 1 - Clean Registrations First up we want to input the Registrations table, and then clean some of the fields from the input. We want to make the following changes:  1. Spelling Mistakes  It looks like there are spelling mistakes in the Online/In Person field, so we need to use the Group Values functionality to group by Spelling. This combines the values so we have In Person & Online.  2. Company Name   Next we can extract the company name from each of the email addresses. To do this we can use a custom split to split of everything after the '@' symbol: Then a second split on the 'Email - Split 1' field to return everything befor

2022: Week 20 - TC22 Session Attendance

Image
 Challenge by: Jenny Martin It's time for TC22 and in celebration of the hybrid virtual and in person conference this year we're bringing you a TC themed challenge! We want to compile a list of those who were unable to attend the sessions they registered for.  If you're new to the Preppin' Data challenges then welcome! We've included some extra hints for this challenge to help you get started, and would recommend going back to the beginning of the year for some more information about what Preppin' Data is all about. Inputs We have 4 input datasets for this challenge: Registrations  Sessions Lookup Table  Online Attendees  In Person Attendees  Requirements Input the data In the Registrations Input, tidy up the Online/In Person field ( hint ) From the Email field, extract the company name ( hint ) We define the company name as being the text following the @ symbol, up to the . Count the number of sessions each registered person is planning to attend ( hint ) Join

2022: Week 19 - Solution

Image
Solution by Tom Prowse and you can download the workflow here .  This week we return to our favourite retailer, Chin & Beard Suds Co (C&BSCo) and are looking to identify some mistakes that are coming through within the sales and actual products sold. Let's look at how we solved the problem.  Step 1 - Combine Size & Sales First we want to input both the Sales & Size Table sheets from our input. From here we can join these tables by using an inner join on Size = Size ID:  Then from here we can clean some of the fields by removing Size, Size ID, and renaming Size-1 to Sales Size. Our table should look like this: Step 2 - Product Set Correct? Next we want to include the Product Set table and clean this so that it's in a format that we can join with our previous branch.  First, we want to ensure that the Product Code field is the same as in the other table. Therefore, we need to remove any of the S codes by using the following calculation:  Product Code REPLACE([Prod

2022: Week 19 C&BSCo Good Sales but Wrong Sizes

Image
 Created by: Carl Allchin This week's challenge brings back every Preppers' favourite retailer, Chin & Beard Suds Co (C&BSCo).  The data team have raised an issue that sales are being made but the products sold are being recorded poorly. Each product sold is recorded but it seems the sales team in each store has been wrongly recording the size of the product.  Each product in our range has a set size. Can you help prepare the data to show how bad the issue is? Input Three worksheets in one Excel workbook   Product Set This is the full list of all products sold Sales This is a list of all of the sales made by Product, Store and Size ID Size Table The lookup table for the Sales Size column Requirements Input all three sheets of data Change the Size ID to an actual Size value in the Sales table Link the Product Code to the Sales Table to provide the Scent information Create an Output that contains the products sold that have the sizes recorded correctly (Output 1) Create a