Posts

2020: Week 44 - Solution

Image
  Solution by Tom Prowse and you can download the full workflow here .  Halloween has just passed so this week we were looking at costume sales across various different countries. This was a click-only challenge, so could you complete it using just the native functionality within Tableau Prep? Step 1 - Group Costume Names The first step this week is to input the data, and then we are going to focus on cleaning the costume names from the various different languages. We are going to use the grouping functionality to do this, and first we will group by Pronunciation . Within the setup, we have changed the sensitivity of the grouping to be as high as possible. As a result, this catches a lot of the different languages, however there are still a couple that we need to go through and manually group ourselves.  We manually group by selecting the from the selection menu on the right-hand side:  We should now have 9 different categories for costumes, and they should all be i...

2020: Week 44

Image
Challenge by: Jenny Martin We're getting spooky this week, not only with Halloween data, but also with another click-only challenge! That's right, typed calculations are absolutely forbidden. We've got sales data from a company selling Halloween costumes around the world, but it certainly needs a little tidying up. With their fiscal year coming to an end on Halloween itself, they want to see how their sales are comparing to last year's. Let's hope the results aren't too scary! Input There is one input this week, containing Halloween costume sales from different countries:  Requirements Remember this is a click-only challenge, no typed calculations allowed! (Although you may rename fields, we're not that harsh)  Input the data. Each costume is in the language of the country the sales occur in. Group these costumes together by their English translation. You should have 9 costumes once you've finished grouping There have been some errors when inputting cou...

2020: Week 43 - Solution

Image
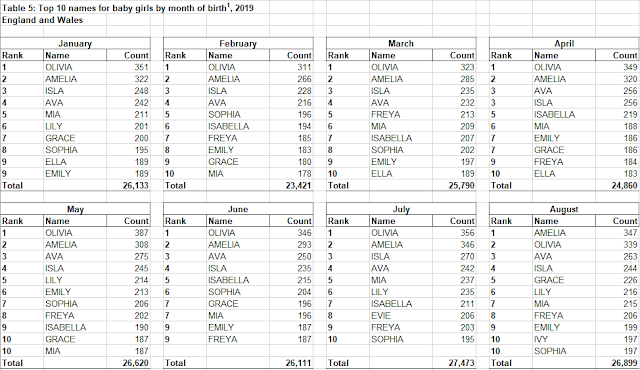
  Solution by Tom Prowse and our full solution can be downloaded here . This week's challenge was based around cleaning a formatted spreadsheet that focused on the most popular baby names in England & Wales from 2019. This sort of problem occurs often when a spreadsheet is formatted nicely in Excel, but not so nicely when trying to use in Prep! Step 1 - Input Files The first task is to input all of the tables for each gender. At first we are only given the option to use a single table from the input, and when bringing this into our workflow, a lot of the months are combined within the same fields. This isn't ideal for Prep! Therefore, the first step is to use the Data Interpreter. This identifies the different tables within the spreadsheet and breaks these down so that each can be a separate input.  Now we have separate inputs for each section we can identify which ones have the same structure, these include: Boys Table 5 A6:O18 = Jan - Apr Table 5 A20:O32 = May-Aug Table ...

2020: Week 43

Image
Challenge by: Jenny Martin Sometimes when researching one Preppin' Data idea, you encounter a rather hideous data structure that makes you wonder, "could Prep handle this?" Suddenly you're on a completely different tangent to the challenge you were originally planning and you've got a chunky Prep workflow that just begs to be turned into a challenge itself. So here we are, looking at the most popular baby names for boys and girls in England and Wales in 2019.  Inputs The data itself comes from the Office for National Statistics : Download inputs There is one input for boys names and one input for girls names. As you can see, each month is its own table and they are laid out next to each other in the Excel sheet. Not an ideal input for Tableau Desktop! Pay particular attention to May and August which have additional rows as there have been ties in the rankings.  Requirements Input the data I recommend starting with the boys names Remove totals Pivot to create a mon...

2020: Week 42 - Solution

Image
  Solution by Tom Prowse and you can download the full solution here .  This week's challenge was all around calculating the Year/Month/Week to Date calculations which are used throughout various different companies to give an indication about how they are performing. Instead of just basing these calculations on a single date, we wanted to take this a step further and compare the Week and Day number so that we are comparing the same periods throughout the year. This may not be the most simple way to solve it, but I wanted to try and make it as future proofed as possible! For some alternative solutions take a look at the Preppin Data Tableau Forums to see some other community members workflows. Step 1 - Create Daily Targets Table Our targets table is currently only a weekly breakdown so we want to use a daily scaffold to help build this out so we have a target for each day.  The first step is to bring in the Transactions table, which we will use for the daily scaffold. Wi...