2021: Week 37 - Solution
Solution by Tom Prowse and you can download the solution here.

This week we had a look at the new generate rows feature within Tableau Prep. This allows us to fill a range within two numbers or dates so that we can generate rows that weren't already existing within the data set.
We revisited the 3rd ever Preppin' Data challenge for this one to see how much easier the new feature makes the solution instead of having to use an additional table to scaffold the data.
Step 1 - Create End Date
Our data table has a start date and a contract length, therefore using this we can create a date for when the contract will finish.
End Date
DATEADD('month',[Contract Length (months)]-1,[Start Date])
We don't want to include the current month so we need to subtract 1 from the Contract Length field and then we can use this date to 'fill in' the gaps between the start and end months.
Our table now looks like this:

Step 2 - Fill in Rows
This next step is where the new feature magic happens! There is a new option in the list of steps that we can create 'New Rows'.

From here we have a few different options on how to configure the tool. We can choose between values from a single field, or values from a range. As we want to go between the start and end dates, we will choose the range of values.
Next, we set up the conditions so that the start date is less than or equal to the end date, then we want to specify the time period between (1 Month), and finally what we want to copy for the new rows (the value from above).

With this setup we will create a structure that looks like this (where the months between the start and end date have been created):

As a result our data table should now look like this:

Step 3 - Running Total
The final step this week is to create a cumulative total for each person over their contract period length. Traditionally we would do this by utilising a self-join and then follow the steps documented here. However, @hiroakimo_tw pointed out on Twitter that you can use window calculations within Prep to solve this problem. To create a running total you can use the following calculation:
Cumulative Monthly Cost
{ PARTITION [Name] : { ORDERBY [Payment Date] ASC : WINDOW_SUM([Monthly Cost])}}
Note, this technique hasn't been officially released by Tableau so there might be some bugs, but for this use case it works!
After calculating the running total we are ready to output our data set which should look like this:
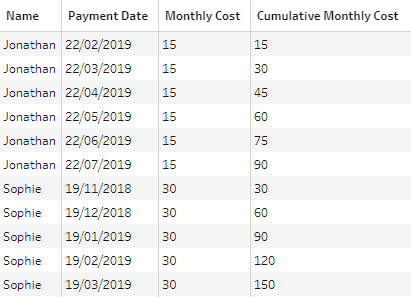
You can download the full output here.
After you finish the challenge make sure to fill in the participation tracker, then share your solution on Twitter using #PreppinData and tagging @Datajedininja, @JennyMartinDS14 & @TomProwse1
You can also post your solution on the Tableau Forum where we have a Preppin' Data community page. Post your solutions and ask questions if you need any help!


