Posts

Showing posts with the label Running Total

2022: Week 15 Property Management

Image
Created by: Tom Smith (Twitter: @tSmithyyy ) You work for a Property Management company and your boss has asked you to compile a report detailing how much revenue the business can expect to make from its existing office space rental contracts. The time frame in focus is from 2021 until 2026 and the board would like to see a cumulative total for each month of a contract. An additional requirement is to create a dynamic table that totals rent paid for completed years across all contracts, as well as year to date figures for the current year, which would update as time goes on. Input files: Rental Contracts Office Space Prices Requirements: Input the Rental Contracts data Work out the length of each contract in months Work out the number of months until each contract expires (imagine today is 13th April 2022) Input the Office Space Prices data and join it to the contracts table Remove duplicated fields Create a row for each month that a rental contract will be live - Retain the details f...
2021: Week 37 - Re-looking at Phone Contract Revenue

Image
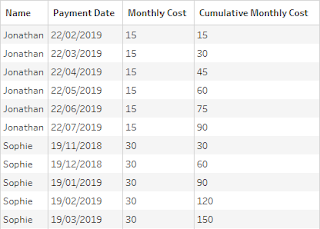
Challenge by Tom Prowse The latest version of Tableau Prep was released this week! This included a great new feature that allows you to generate new rows that aren't already available within your data set. If you want to know more then check out Carl's blog post where he has this covered! As there's a new feature that makes our lives that little bit easier, I thought it would be a great opportunity to revisit one of the older challenges to see how things have changed. Therefore this week we are nearly going all the way back to where Preppin' Data began... Challenge 2019 Week 3!  If you haven't completed this challenge then you can find the original post here , but for the challenge we are going to calculate the recurring revenue based on a mobile phone contract length. This can be completed in the new version of Prep (2021.3 onwards) or an older version if you haven't had the opportunity to download it yet (better yet, why not try both!).  Scenario You work for...

2021: Week 8 - Karaoke Data

Image
Challenge by: Jenny Martin Recently I was helping a colleague prep some karaoke data and I thought it was too fun a subject to resist turning into a Preppin' Data challenge! I had a lot of fun creating the dataset and imagining the type of person who may sing one song and then not bother with the rest of the session.  We will need to make some assumptions as part of our data prep: Customers often don't sing the entire song Sessions last 60 minutes Customers arrive a maximum of 10 minutes before their sessions begin I will warn you that this challenge may be a little on the trickier end of the spectrum! Inputs Karaoke song choices and what time they began  Customer entry times  Requirements Input the data Calculate the time between songs ( help ) If the time between songs is greater than (or equal to) 59 minutes, flag this as being a new session ( help ) Create a session number field ( help ) Number the songs in order for each session ( help ) Match the customers to the co...

2020: Week 47

Image
Challenge by: Jenny Martin Prep Air want to do some analysis of flight delays to and from its key destinations. After many discussions with the airport, they finally agreed to share this data. However, it's not in the best structure, so we'll definitely need to do some prep before our analysis can begin. (It's almost like they're afraid of what we'll find!) A special thank you to Michael  this week for sharing a similarly structured dataset with us that sparked the idea for this challenge! Inputs We have 2 inputs this week: Information on the delayed flights, separated across multiple lines Aggregated view of flights which were not delayed Requirements Input the data Aggregate the data so that you have 1 row per flight delay, instead of the current 3 rows Make sure all Airport codes are valid. Group those which are not. Calculate the total delay and number of delayed flights for each Airport, for each journey type Combine with information on flights which were not d...

2019: Week 28 Solution

Image
You can view our full solution workflow below and  download it here ! Our full solution workflow. I’ve seen a number of solutions shared with us via Twitter, some more streamlined than this so for alternate ways of achieving this outcome just search Twitter for the  #PreppinData hashtag ! In particular, the  solution by @ArseneXie  streamlines the pivoting steps and the self-join/aggregation step. For this write-up we’ll discuss our original solution as a base point. 1. Use Data Interpreter to fix up field names. As our input data is poorly formatted, by ticking ‘Use Data Interpreter’ we can get our first and second row headers merged together for something meaningful instead of ‘F6’, ‘F7’, ‘F8’, and so on. 2. Use a ‘Wildcard Union’ to pull the date from the sheet name. Part of the challenge includes getting an accurately formatted date & time field. However, the data itself is contained only in the sheet name. To get around this we can change ou...

2019: Week 28

Image
Recently here at Chin & Beard Suds Co, we've become suspicious that some our employees in our flagship store (found on the 96th floor of the Shard) are slacking off and taking their jobs for granted.  We think their productivity might be linked with how close they are to the nearest manager and who they're interacting with. To investigate this we've spent time undercover observing 3 random employees during a typical working day and recording whether they're on task. We record in intervals of between 1 & 3 mins and also note down the rough proximity of the manager on duty and who they interacted with most during each interval. We've also noted down the time we started observing each employee but not the actual start time of each interval. This current data format doesn't work well in Tableau, so we need to do some clean-up and find a way to get some actual date-times for each interval. The input. Requirements Input the data file . For each ...

2019: Week 27 Solution

Image
You can view our full solution workflow below and download it here ! The full solution workflow. Comparing dates against Valentine's Day To start with we need to calculate whether each date is before or after February 14th 2019. For this challenge we’re counting Feb 14th itself as ‘Pre’ Valentines day doesn’t end until midnight that night. To calculate this we can simply use some Boolean operators in a calculation: [Pre / Post Valentines Day] IF [Date] > #2019-02-14#   //If the date is after Valentine’s day…     THEN "Post"             //then label it as ‘Post’…     ELSE "Pre"              //else label it as ‘Pre’.   END This returns the correct label of ‘Pre’ or ‘Post’ for each date. This works as Tableau allows you to manually provide dates in the following format: #yyyy-mm-dd# . Create a Running Total of ...

2019: Week 27

Image
At Chin & Beard Suds Co (our Preppin' Data fake company), one of our non-executive directors has asked about the effects of Valentine's Day on our store sales. Sadly, the non-exec director isn't very good with Table Calculations in Tableau Desktop so we have promised a data set to allow them to build their own views with all of the calculations pre-computed. Here's the dashboard the non-exec director wants: Here's my version Requirements: Input the Data Determine if the sales date is pre- or post- Valentine's day Work out the running total of sales for each store, restarting after Valentine's day to allow us to compare the two 14 day periods Output: One data set (and dashboard for bonus points - remember no table calcs!) Your output date should have: 56 rows (57 including headers) 5 columns: Date Store Pre / Post Valentine's day flag Daily Sales Value Running Sales Value (remember this should restart per store and ...
