Posts

Showing posts from September, 2021

2021: Week 39 - Painting Bikes

Image
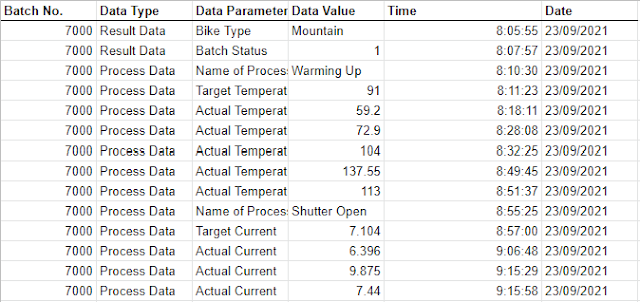
Challenge by Tom Prowse.  This week we make a return to our Bike store but this time we are looking at the painting process within the factory. The factory has a process where different bikes go through a process to be painted and the engineers are provided with some indicator values as the process progresses. It is vital that the engineers are able to track these indicators so they can keep an eye on whether the process is hitting it's target or there are any potential problems.  The data is currently provided in a bit of an unfriendly way with all of the parameters being in a single column. Data is also only provided when a value changes, therefore we should assume that the process value is the same as the previous value until it is updated later in the process. In order to get some value from the data set we need to change the structure and do some cleaning before we can visualise this with Tableau Desktop.  From the data set the engineers would like to have some information on

2021 Week 38 - Solution

Image
Solution by Tom Prowse and you can download the workflow here .  The challenge this week took a look at what the best movie trilogies of all time were. This is off the back of Jenny's viz on Tableau Public so lets see how we can prepare the data to be visualised.  Step 1 - Average, Highest & Rank Trilogies Using the Films input table, we can start by calculating the average rating of each trilogy by using a FIXED LOD:  Trilogy Average   We can then repeat this same process to find the Max rating: Trilogy Max   Then finally we can rank the trilogies based on their average rating:  Trilogy Rank Note: There seems to be an error in the way that Prep is calculating this rank, so don't worry if your output is different! Our table of data should now look like this:  Step 2 - Trilogy Table Before we combine the two tables together, we first need to remove the word 'trilogy' from each of the Trilogy field. This can be done easily by using an automatic split on the Trilogy f

2021: Week 38 - Trilogy

Image
 Challenge By: Jenny Martin Recently, I've been playing with data about the best movie trilogies of all time, according to IMDb. So I thought I'd create a Preppin' Data challenge to allow you all to do the same! View on Tableau Public Inputs There are 2 inputs for this challenge: Top 30 Trilogies  Films  Requirements Input the data Split out the Number in Series  field into Film Order  and Total Films in Series Work out the average rating for each trilogy Work out the highest ranking for each trilogy Rank the trilogies based on the average rating and use the highest ranking metric to break ties (make sure you haven't rounded the numeric fields yet!) We have noticed a slight error in the way that Tableau Prep is calculating this rank, so don't worry if your output is different to ours, we are investigating! Remove the word trilogy from the Trilogy field Bring the 2 datasets together by the ranking fields Output the data Output 7 fields Trilogy Ranking Trilogy Trilog

2021: Week 37 - Solution

Image
Solution by Tom Prowse and you can download the solution here .  This week we had a look at the new generate rows feature within Tableau Prep. This allows us to fill a range within two numbers or dates so that we can generate rows that weren't already existing within the data set. We revisited the 3rd ever Preppin' Data challenge for this one to see how much easier the new feature makes the solution instead of having to use an additional table to scaffold the data. Step 1 - Create End Date Our data table has a start date and a contract length, therefore using this we can create a date for when the contract will finish. End Date DATEADD('month',[Contract Length (months)]-1,[Start Date]) We don't want to include the current month so we need to subtract 1 from the Contract Length field and then we can use this date to 'fill in' the gaps between the start and end months. Our table now looks like this:  Step 2 - Fill in Rows This next step is where the new featur

2021: Week 37 - Re-looking at Phone Contract Revenue

Image
Challenge by Tom Prowse The latest version of Tableau Prep was released this week! This included a great new feature that allows you to generate new rows that aren't already available within your data set. If you want to know more then check out Carl's blog post where he has this covered! As there's a new feature that makes our lives that little bit easier, I thought it would be a great opportunity to revisit one of the older challenges to see how things have changed. Therefore this week we are nearly going all the way back to where Preppin' Data began... Challenge 2019 Week 3!  If you haven't completed this challenge then you can find the original post here , but for the challenge we are going to calculate the recurring revenue based on a mobile phone contract length. This can be completed in the new version of Prep (2021.3 onwards) or an older version if you haven't had the opportunity to download it yet (better yet, why not try both!).  Scenario You work for

2021: Week 36 - Solution

Image
  Solution by Tom Prowse and you can download the workflow here.  There have been some big changes to our lives in the past couple of years, so this week we looked back at what people have been searching for on Google and how this has changed.  Step 1 - Average Index First we are going to focus on the Timeline data table, where we want to calculate the overall average index for each search term. Before we can calculate the average, we need to transform the table by pivoting the main search terms from columns to rows. We can use a Wildcard pivot for this by using the matching pattern 'World':  After the pivot, we have the search terms in a single column but we need to do some tidying to remove the 'Worldwide' part. This can be easily done with an automatic split, or by using a custom split to return the first occurrence before the ':' separator.  Once we have tidied and renamed some of the fields, our table should look like this: Now we have the table in this fo

2021: Week 36 - What's Trendy?

Image
 Challenge By: Jenny Martin For this week's challenge, I wanted to use Google Trends to take a look back over the past couple of years and see what people were searching for. In particular, are these categories still as popular now as they were in peak lockdown? How does the experience vary around the world? We'll be looking at: Pet adoption (who didn't want a furry work from home buddy?!) Online streamer (can one make money from playing video games?) Staycations (everyone's favourite word, right?) Inputs There are 2 inputs this week: Timeline - indexes for how popular the term is  Country Breakdown - the percentage of these terms popularity in each country  Requirements Input the data Calculate the overall average index for each search term Work out the earliest peak for each of these search terms For each year (1st September - 31st August), calculate the average index Classify each search term as either a Lockdown Fad or Still Trendy based on whether the average inde

2021: Week 35 - Solution

Image
 Solution by Tom Prowse and you can download the workflow here.  This week the challenge was inspired by Jenny putting some pictures up in her house and it just goes to show that a Preppin' Data challenge can really come from anywhere! Step 1 - Split Widths & Lengths First we need to split apart the width and lengths for both the frames and picture sizes. The sizes are a mixture of different formats and measurements so let focus on the Pictures table first.  Within the pictures table we have all of the measurements in CMs so we don't need to make an conversions. However, we do have one measurement which is a square (24cm2) so this has 24cm as the height and width.  To deal with this, we can first we want to split length from the start of the string. There isn't a clear separator to do this easily, however using the Automatic split will give us the required numbers that we need from either side of the 'x'. This provides us with a separate field for both the heig