Posts

Showing posts from February, 2023

2023: Week 8 - Solution

Image
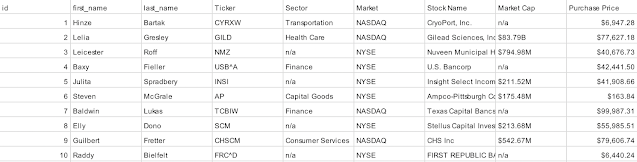
Solution by Tom Prowse and you can download the workflow here .  It's the final week of the Intermediate month challenges and this week we are visiting the trading floor of our fictional bank - The Data Source Bank. We want to clean up some of the trading data and then identify the top trades across a series of different ways that we look at companies. Step 1 - Input Data First we want to input all of our input files for each month. To do this we want to utilise the 'Union Multiple Tables' feature within the Tableau Prep input step.  After inputting one of the files, we can then choose 'Union Multiple Tables' and then use the term 'MOCK_DATA*' as our matching pattern. This will bring all of the fields that match this pattern into our data set, whilst also adding any others that will come into that folder in the future. Note: depending on your version of Tableau Prep, this might look slightly different. After using the wildcard input we should now have all of

2023: Week 8 - Taking Stock

Image
 Created by: Carl Allchin For the final week of Intermediate Month, our data set needs so cleaning and grouping to allow us to analyse the top trades from The Data Source Bank's trading floor.  No Wolf on Wall Street moments have happened but we've had some big trades happen across a wide range of companies so we need to understand these more. Can you help us find the top 5 trades for a series of different ways we look at the companies traded and the prices of the trades? Input There are 12 files to input this week. Each number in the file name reflects the month it came from (January's file doesn't have a value) The data can be found here Requirements Input each of the 12 monthly files Create a 'file date' using the month found in the file name The Null value should be replaced as 1 Clean the Market Cap value to ensure it is the true value as 'Market Capitalisation' Remove any rows with 'n/a' Categorise the Purchase Price into groupings 0 to 24,

2023: Week 7 - Solution

Image
  Solution by Tom Prowse and you can download the full workflow here.  We are starting to move into some trickier challenges during the Intermediate month... this time looking at flagging fraudulent suspicions by combining multiple data sets and flagging transactions based on given rules.  Step 1 - Transaction Path & Detail First we want to input the transaction path table. This will become our first input but we need to make some changes so that we ensure that it matches the other tables. After inputting, we can update the names of the fields so to remove the _ from any field names. Luckily there aren't too many fields in this table, so we could rename them individually, but we could also utilise the 'Rename Fields' functionality in Tableau Prep.  From here we can select the fields that we want to rename, and then also define what we want to replace within the field name. In our case we want to select Account_From and Account_To, then replace the '_' with a &#

2023: Week 7 - Flagging Fraudulent Suspicions

Image
Challenge by: Jenny Martin As in many organisations, sometimes the answer to a question can only be found by combining multiple datasets together. Data Source Bank are looking to find transactions which may possibly be fraudulent. They define potentially fraudulent transactions as: Being more than £1,000 in value Excluding cancelled transactions Platinum Bank Accounts have different rules for identifying fraudulent transactions so we will exclude them from our analysis What the fraud team need is the ability to make phone calls to customers to double check whether these transactions are genuine. Inputs The data is spread across 4 different tables. We've provided an extract for each of these.  Transaction Path  Transaction Detail  Account Information  Account Holders  Requirements Input the data For the Transaction Path table: Make sure field naming convention matches the other tables i.e. instead of Account_From it should be Account From For the Account Information table: Make sur

2023: Week 6 - Solution

Image
Solution by Tom Prowse and you can download the workflow here .  We continue this month with the 2nd intermediate month challenge. This helps to build on our knowledge from previous weeks and cover more data prep techniques. For the challenge this week, we are looking at Survey data which can be notoriously hard to work with when preparing for visualisation. Step 1 - Reshape Data After inputting our data we want to change the shape from wide to long. We can do this by pivoting all of the fields that contain a score into a single field, however we don't want a single value field but for it to bit split out based on Online or Mobile. We can create this 2nd value field by using a handy technique in the Tableau Prep pivot step. Normally, we only add in a single pivot values, however you can press on the little + icon to add a 2nd set of values. Within each of the values we can use a wildcard pivot on 'Mob' and 'Onl' and this will create the split of the scores: We can t

2023: Week 6 - DSB Customer Ratings

Image
 Challenge by: Jenny Martin For the second intermediate challenge, Data Source Bank are interested in surveying their customers. They're trying to work out whether users prefer to use the Online Interface for their banking requirements, or whether they prefer the Mobile App. Customers can be quite fickle and so it's probably best to take some of their ratings with a pinch of salt! We'll use an aggregated view to hopefully cut through the noise. Input The results of a survey asking customers to rate, on a scale of 1-5, different areas for the Mobile App and the Online Interface. Requirements Input the data Reshape the data so we have 5 rows for each customer, with responses for the Mobile App and Online Interface being in separate fields on the same row Clean the question categories so they don't have the platform in from of them e.g. Mobile App - Ease of Use should be simply Ease of Use Exclude the Overall Ratings, these were incorrectly calculated by the system Calcula

2023: Week 5 - Solution

Image
Solution by Tom Prowse and you can download the workflow here .  We move into our first intermediate month challenge this week, and we are looking at extending the functionality of Tableau Prep by introducing analytical calculations. If you are a Tableau Desktop user then you will be familiar with Level of Detail (LOD) calculations and we'll utilise these to make the end user's life a little easier by doing a couple of calculations for them. Step 1 - Bank Code & Month Name First we need to extract the Bank from the Transaction Code field. From the requirements we know that the letters within Transaction Code make up the Bank field, therefore we can use a custom split to extract anything before the first '-':  From here we can rename the new field 'Bank':  We can also extract the month name from the Date field. Again, we can use the in-built functionality within Tableau Prep to help us out here. From the Transaction Date, we can choose Convert Date and select