Posts

Showing posts with the label Aggregate

2022: Week 25 - Housing Happy Hotel Guests
Image
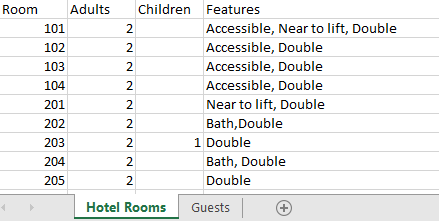
Challenge by: Jenny Martin Imagine you're working at a hotel and the process of assigning guests to hotel rooms is very manual and often based off the expertise of those that have worked in the hotel for a long time. You've managed to pick the experts' brains to get a comprehensive list of the features of each hotel room and you want to build a simple proof of concept workflow that would allow users to immediately see which rooms would be suitable for each guest. We're not worrying about assigning guests to rooms just yet, this is just the first step to proving how an automated workflow could help to make life easier! For a room to be suitable for a guest it must: Have enough capacity for all adults and children in the party (no one's allowed to sleep on the floor!) Have either double or twin beds as per the guest's preference Be accessible if the guest has accessibility requirements Satisfy as many of the additional requirements as possible Inputs Hotel Rooms  ...

2021: Week 51 - Departmental December - IT

Image
 Challenge by: Jenny Martin It's the IT department's turn to receive our help this week. Rather than optimising the data for feeding into a data visualisation tool, we're going to think about how to optimally store data. In particular, we're going to be thinking about breaking a dataset down into fact and dimension tables.  In many challenges, we focus on bringing datasets together that have a common ID field. Databases will often follow a star schema, where each dimension is a separate table that can join onto the main fact table. We have received the following desired schema from IT: Input We have one large table to break down into the desired fact and dimension tables: Requirements Input the Data Split out the store name from the OrderID Turn the Return State field into a binary Returned field Create a Sales field Create 3 dimension tables for Store, Customer and Product When assigning IDs, these should be created using the dimension and minimum order date fields so ...

2021: Week 43 - Is that the case?

Image
 Challenge by: Beth Kairys A couple of weeks ago, at the Tableau Prep User Group, co-leader Beth Kairys presented a brilliant workflow which covers a lot of the fundamentals of data prep. Luckily, she agreed to allow us to turn it into a Preppin' Data challenge, thanks Beth! If you missed the session or want a sneaky peak at the solution, then click here to watch the user group recording. The purpose of the challenge is to get our cases data into a format where we can reproduce the following chart (which you're welcome to do as a bonus exercise too!) Inputs There are 3 inputs for this challenge: Business Unit A cases  Business Unit B cases  Risk Level lookup table  Requirements Input the data From the Business Unit A Input, create a Date Lodged field Use the lookup table to update the risk rating Bring Business Unit A & B together We want to classify each case in relation to the beginning of the quarter (01/10/21): Opening cases = if the case was lodged before...

2021: Week 40 - Animal Adoptions

Image
 Challenge By: Jenny Martin I'm sure if we took a poll, there would be a large number of us who have become pet owners in the past couple of years. I myself have become the owner of a little kitten called Pyrrha.  It got me wanting to play with some pet data and I came across Austin Animal Center. They claim  over 90% of animals entering the center, are adopted, transferred to rescue or returned to their owners, which is impressive and a statistic we can validate for ourselves! Input Feel free to grab your own up to date data from the link above, or use this extract that we have downloaded: Requirements Input the data Remove the duplicated date field Filter to only cats and dogs (the other animals have too small a data sample) Group up the Outcome Type field into 2 groups: Adopted, Returned to Owner or Transferred Other Calculate the % of Total for each Outcome Type Grouping and for each Animal Type Output the data Output 3 fields Animal Type Adopted, Returned to Owner o...

2021: Week 34 - Excelling with lookups

Image
 Challenge By: Jenny Martin As we come to the end of our excel challenges month, it seems only right to think about vlookups and index matches. In Excel, these are great functions for bringing together data from different worksheets without having to manually copy and paste.  Our scenario this week is looking at Employee Sales at Allchains for each month of the year so far and we want to compare this to their Monthly Targets, stored on another sheet. Inputs We have 2 inputs this week: Employee Sales Employee Targets Requirements Input data Calculate the Average Monthly Sales for each employee In the Targets sheet the Store Name needs cleaning up Filter the data so that only employees who are below 90% of their target on average remain For these employees, we also want to know the % of months that they met/exceeded their target Output the data Output 5 fields Store Employee Avg monthly Sales % of months target met Monthly Target 4 rows (5 including headers) After you finish the...

2021: Week 30 - Lift Your Spirits

Image
 Challenge By: Jenny Martin Inspiration for Preppin' challenges can come from anywhere. I've recently moved into a block of flats and let me tell you, I spend a lot of time waiting for a lift (or elevator if you're across the pond). It got me pondering whether the lift is operating optimally. Is it better to stay on the floor that you drop passengers until the next time someone calls a lift, or should the lift return to the most common starting floor? Input There is one input this week, detailing the time of each trip the lift takes, including which floor the passengers enter the lift and which floor the passengers leave the lift.  For simplicity, assume that the lift does not stop mid-journey to pick up new passengers, but completes its current trip before starting a new one. Requirements Input the data Create a TripID field based on the time of day Assume all trips took place on 12th July 2021 Calculate how many floors the lift has to travel between trips The order of flo...

2021: Week 15 - Restaurant Menu & Orders

Image
Challenge by Amalia García-Vellido Santías We have another guest challenge creator with this week's challenge coming from Amalia.  This week we want to analyse the orders that customers have made over a period of time in our restaurant Serendipia. In order to identify how much money we earn each day of the week and also to discover who our top customer is. We are going to be using calculations, pivots and aggregations so lots of the fundamental techniques that are used within data prep! Inputs Menu - contains the menu of the restaurant (notice that the structure is not ideal) 9 fields 10 rows (11 + header) Orders  - each row represents the order a single customer have made at a certain date 3 fields 40 rows (41 + headers) Requirements Input the data Modify the structure of the Menu table so we can have one column for the Type (pizza, pasta, house plate), the name of the plate, ID, and Price ( hint ) Modify the structure of the Orders table to have each item ID in a different r...

2021: Week 8 - Karaoke Data

Image
Challenge by: Jenny Martin Recently I was helping a colleague prep some karaoke data and I thought it was too fun a subject to resist turning into a Preppin' Data challenge! I had a lot of fun creating the dataset and imagining the type of person who may sing one song and then not bother with the rest of the session.  We will need to make some assumptions as part of our data prep: Customers often don't sing the entire song Sessions last 60 minutes Customers arrive a maximum of 10 minutes before their sessions begin I will warn you that this challenge may be a little on the trickier end of the spectrum! Inputs Karaoke song choices and what time they began  Customer entry times  Requirements Input the data Calculate the time between songs ( help ) If the time between songs is greater than (or equal to) 59 minutes, flag this as being a new session ( help ) Create a session number field ( help ) Number the songs in order for each session ( help ) Match the customers to the co...

2021: Week 6 - Comparing Prize Money for Professional Golfers

Image
Challenge By: Jenny Martin What's one of the benefits of preparing your own data? Being able to start your analysis sooner! Sometimes I can find opening Tableau Desktop to explore my data gets a little distracting by trying to visualise it before I've decided on the story. Starting my analysis of the dataset in Tableau Prep helps me, personally, to stay more focused! It's clear where the outliers are, what the distribution of the dataset is and therefore what the story should be. For this week's challenge we're looking at a dataset that was used in December 2020 for Sports Viz Sunday  (thanks to Kate Brown for sharing!) This dataset comes from the PGA and LPGA  2019 Golf tours and lists the total prize money for the top 100 players. For those of us who aren't too familiar with golf, the PGA is the men's tour, whilst the LPGA is the women's tour. Input We have one input this week: Official Money Requirements Input the data Answer these questions: What...

2021: Week 5 - Solution

Image
Solutions by Jenny Martin & Jonathan Allenby and you can download the  full workflows here .  This week we were looking at de-duplicating and updating our training attendee data. In this challenge we mentioned that you can use Prep to avoid having to use LODs in Tableau Desktop, especially as Prep is so great at de-duplication using Aggregate steps. However, if you're comfortable with LODs then you can use them within Prep where it is more manageable to track and modify your changes. In the first solution, Jenny demonstrates how to avoid these LODs completely and in the second Jonathan shows how you can use LODs to achieve the same outcome. Both solutions are valid and which one you gravitate towards will likely just be a matter of personal preference and instinct. Solution A : No LODs Step 1 - Getting the current Account Managers and IDs In order to avoid LODs and table calculations we're going to make use of the Aggregate and Join steps in order to summarize and update o...

2021: Week 5 - Dealing with Duplication

Image
Challenge by: Jenny Martin Have you ever been working with a dataset in Tableau Desktop and noticed some duplication occurring? Of course, this is something you can fix with some potentially tricky LODs or Table Calc filters, but wouldn't it be nicer for your dataset to be viz ready before heading into Desktop?  If you attended the Tableau Fringe Festival last year, this concept may feel familiar, as I did a quick demo explaining why I, personally, would prefer to use Prep to solve my duplication issues. You can find the video here  if you like. Input The dataset we'll be working with for this challenge follows the same theme as the Fringe Festival. We have information relating to which of our Clients are attending our training sessions. Also included in our dataset is which Account Managers look after which Clients. However, we have historical information about Account Ownership which is leading to duplication. So how can we fix it? Requirements If you're new to the techni...

2021: Week 4

Image
This is the last in the 'Starter Challenges' series to get you up and Preppin' to start the new year. We've enjoyed running this mini-series so much we're already looking at creating another similar series later in the year.  This week's challenge involves picking up some more of the fundamental skills and gives you some chances to practice some of the skills you've picked up over the last few weeks. As always, we'll be guiding you along the way with some useful help links if you need a couple of reminders or chance to explore those new techniques.  The new technique for you to learn this week is Joins. If you've worked with different data solutions for a number of years, you'll be familiar with Joins but if you are new you're in for a treat! Joins allow us to bring two data sources together. This allows for much easier, richer and deeper analysis as data is often in many different locations. Use the help links if this is a new technique for ...

2021: Week 3

Image
This week is the third in the Starter Challenges series we are running to kick off 2021.   This challenge will introduce you to the two main types of reshaping data, pivoting and aggregation. We used aggregation last week so we are building on this technique this week. We will also let you work with Unions where we stack data sets that have similar structures on top of each other.  As with all of our January 2021 challenges, we will be sharing useful links to helpful videos and articles that will give you more technical support if you need it.  This week's challenge sees us looking at the Accessory Sales at our Bike Store. Input One Excel sheet with 5 tabs of data: London Leeds York Manchester Birmingham The structure of the data is the same in each worksheet.  Requirements Input the data source by pulling together all the tables ( help ) Pivot 'New' columns and 'Existing' columns ( help ) Split the former column headers to form: ( help ) Customer Type Product Ren...