Posts

Showing posts with the label Joins

2022: Week 47 - Chelsea Managers per Prime Minister

Image
Challenge by: Stephen Moyse It's been a tumultuous time for UK politics recently, with 3 different Prime Ministers so far this year! Similarly, being a football manager isn't always the most secure a position. So what's the relationship between the 2? Just how many Chelsea Managers have there been for each Prime Minister?  The challenge was a brilliant idea brought to us by data schooler Stephen Moyse and we're excited what other ideas he will bring to us in future! Inputs Prime Ministers  Chelsea Managers  Chelsea Matches  Requirements Input the data For the Prime Ministers data: Group together Sir Winston Churchill and Winston Churchill Split the dates to create Start Date PM and End Date PM For the null End Date PM, replace with today's date Create a row for every day the Prime Minister was in office For the Chelsea Manager data: Remove unnecessary fields and rename remaining fields Clean the Chelsea Managers field For the null End Date CM, replace with today...

2022: Week 38 - Salesforce Standard Connections for Dreamforce22

Image
Challenge by:  Lorna Brown This week comes a special challenge because it is Dreamforce conference week. Wherever you are in the world you can participate in Dreamforce as they have a virtual and in person element in San Francisco. This challenge is about trying to replicate one of many of the Standard Salesforce connections that you can have in Tableau Desktop. Tableau have created these standard connections, for when you connect Salesforce, which allows you to create the most common data schemas available. If you are not aware of what Salesforce is, it is a CRM platform which allows you to track leads & opportunities, and I’m sure it does much more than that.  We have different experiences when we connect to Salesforce via Tableau Prep and Desktop, which is why we want to be able to recreate some of those standard connections within Prep, to allow us to join onto a variety different data sets for future use. Another difference when we are connecting to Tableau Prep over ...

2022: Week 20 - TC22 Session Attendance

Image
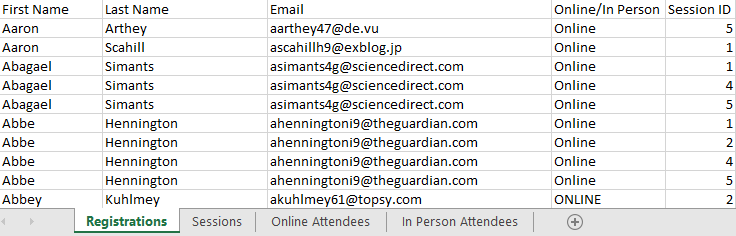
 Challenge by: Jenny Martin It's time for TC22 and in celebration of the hybrid virtual and in person conference this year we're bringing you a TC themed challenge! We want to compile a list of those who were unable to attend the sessions they registered for.  If you're new to the Preppin' Data challenges then welcome! We've included some extra hints for this challenge to help you get started, and would recommend going back to the beginning of the year for some more information about what Preppin' Data is all about. Inputs We have 4 input datasets for this challenge: Registrations  Sessions Lookup Table  Online Attendees  In Person Attendees  Requirements Input the data In the Registrations Input, tidy up the Online/In Person field ( hint ) From the Email field, extract the company name ( hint ) We define the company name as being the text following the @ symbol, up to the . Count the number of sessions each registered person is planning to attend ( hint )...

2022: Week 17 - The Price of Streaming

Image
Challenge by: Jenny Martin This challenge was inspired by a recent use case from a client. It involves bringing together 2 datasets which have different levels of aggregation. They were initially trying to do this in Tableau Desktop but getting a bit muddled with the calculations going on "in the background." So let's use the power of Prep to map out the process and make everything much clearer.  Inputs Streaming sessions from users  Avg Pricing for each month  Requirements Input the data Check the location field for spelling errors Data roles may help you identify these Fix the date fields so they are recognised as date data types Aggregate the data to find the total duration of each streaming session (as identified by the timestamp) We need to update the content_type field: For London, Cardiff and Edinburgh, the content_type is defined as "Primary" For other locations, maintain the "Preserved" content_type and update all others to have a "Second...

2022: Week 7 - Call Center Agent Metrics

Image
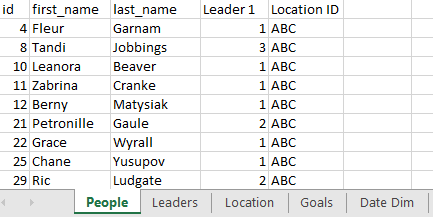
Challenge by: Kate Brown This week we have another incredible challenge created by Tableau Social Ambassador Kate Brown : For this week’s challenge we need to create a data set for our call center agent metrics. We have 2 Excel files that contain the monthly metrics for the agent and another file that contains the agent, leader, location, and goals.  If you work with databases you may encounter situations were you have one table that has ids and another table(s) that have the descriptors for those ids. We aren’t connecting to a database in this example, however, think about the people, location, leader, and date inputs in that way. Inputs People Data: People  Leaders  Location  Goals  Date Dim  Metric Data 2021: Jan - Dec Requirements Input the data People, Location, Leader, and Dates: Join the People, Location, and Leader data sets together Remove the location id fields, the secondary leader id field Create last name, first name fields for the agent and th...

2021: Week 51 - Departmental December - IT

Image
 Challenge by: Jenny Martin It's the IT department's turn to receive our help this week. Rather than optimising the data for feeding into a data visualisation tool, we're going to think about how to optimally store data. In particular, we're going to be thinking about breaking a dataset down into fact and dimension tables.  In many challenges, we focus on bringing datasets together that have a common ID field. Databases will often follow a star schema, where each dimension is a separate table that can join onto the main fact table. We have received the following desired schema from IT: Input We have one large table to break down into the desired fact and dimension tables: Requirements Input the Data Split out the store name from the OrderID Turn the Return State field into a binary Returned field Create a Sales field Create 3 dimension tables for Store, Customer and Product When assigning IDs, these should be created using the dimension and minimum order date fields so ...

2021: Week 36 - What's Trendy?

Image
 Challenge By: Jenny Martin For this week's challenge, I wanted to use Google Trends to take a look back over the past couple of years and see what people were searching for. In particular, are these categories still as popular now as they were in peak lockdown? How does the experience vary around the world? We'll be looking at: Pet adoption (who didn't want a furry work from home buddy?!) Online streamer (can one make money from playing video games?) Staycations (everyone's favourite word, right?) Inputs There are 2 inputs this week: Timeline - indexes for how popular the term is  Country Breakdown - the percentage of these terms popularity in each country  Requirements Input the data Calculate the overall average index for each search term Work out the earliest peak for each of these search terms For each year (1st September - 31st August), calculate the average index Classify each search term as either a Lockdown Fad or Still Trendy based on whether the average inde...

2021: Week 35 - Picture Perfect

Image
 Challenge By: Jenny Martin Data preppin' ideas really are all around! I was hanging some pictures the other week and I had some weird and wonderful sizes, so working out the perfect frames was a bit tiresome. If only I could use a data preppin' tool to speed up the process...  Inputs We have 2 inputs this week: Picture sizes  Frame sizes    Requirements Input the data Split up the sizes of the pictures and the frames into lengths and widths Remember an inch is 2.54cm Frames can always be rotated, so make sure you know which is the min/max side See which pictures fit into which frames Work out the area of the frame vs the area of the picture and choose the frame with the smallest excess Output the data Output 4 fields Picture Frame Max Side Min Side 14 rows (15 including headers) After you finish the challenge make sure to fill in the  participation tracker , then share your solution on Twitter using  #PreppinData  and tagging  @Datajedininja...

2021: Week 25 - The Worst Pokémon

Image
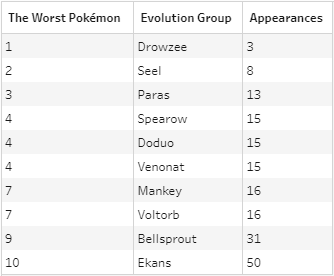
Challenge By: Jenny Martin Often our stakeholders can have very niche knowledge and their requests may baffle us. Luckily, as data preppers we have the tools to tackle any dataset, no matter how bizarre. Yes, Carl and Tom have allowed me to create another Pokémon challenge! The idea came from a  YouTube video that I stumbled across: Who Is Pokemon’s LEAST Favorite Pokémon? The logical steps applied in the video felt like they were screaming out for a Preppin' Data challenge to verify the results! But be warned, the answer to this challenge will differ from the conclusion of the video, due to differing datasets. Inputs We have multiple inputs for this challenge: Gen 1 Pokémon (from Pokémon Database ) Evolution Group (from Bulbapedia - also see Preppin' Data 2021 week 10 )  Evolutions (Bulbapedia) Mega Evolutions (Pokémon DB) Alolan Pokémon (Pokémon DB) Galarian Pokémon (Pokémon DB) Gigantamax Pokémon (from IGN ) Unattainable Pokémon in Sword & Shield (Pokémon DB) Ani...

2021: Week 22 - Answer Smash

Image
Challenge By: Jenny Martin Recently, my family and I have become quite invested in the TV quiz show Richard Osman's House of Games . The final round is always a round called Answer Smash. In this round you have a picture and question and you have to "smash" the name of the picture with the answer to the question, as per the below example. I thought it would be fun to work backwards and have a list of answer smashes from which we have to extract the Preppin' participant and the answer to the question! Inputs 1. Answer Smash list 2. Names 3. Questions 4. Categories Requirements Input the data The category dataset requires some cleaning so that Category and Answer are 2 separate fields ( hint ) Join the datasets together, making sure to keep an eye on row counts ( hint ) Filter the data so that each answer smash is matched with the corresponding name and answer ( hint ) Remove unnecessary columns Output the data Output 5 fields Q No Name Question Answer Answer Smash 20 r...

2021: Week 10 - Pokémon Hierarchies

Image
Challenge By: Jenny Martin I can hear the hesitancy already surrounding this challenge. "I know nothing about Pokémon, how can I participate?" Well, rest assured, you don't need to understand the data in order to work with it and complete this challenge. In fact, I believe this challenge could help with most hierarchical data.  The aim of this challenge is to group Pokémon into Evolution Groups. Why? So that when we select any Pokémon, we can see all the information about what they evolved from, what they will evolve to etc. In the example below, Bulbasaur evolves into Ivysaur, who then evolves into Venusaur. Choose another Pokémon like Flareon and we can see it evolves from Eevee, who has multiple evolution possibilities. See full dashboard here How is this applicable to other hierarchical data? Well imagine that a Pokémon that has a null in the Evolves From field is similar to an employee at Work Level 1 in an organisation. Their manager would then sit in the Evolv...