Posts

Showing posts from November, 2022

2022: Week 48 - Tiddlywinks Tidy

Image
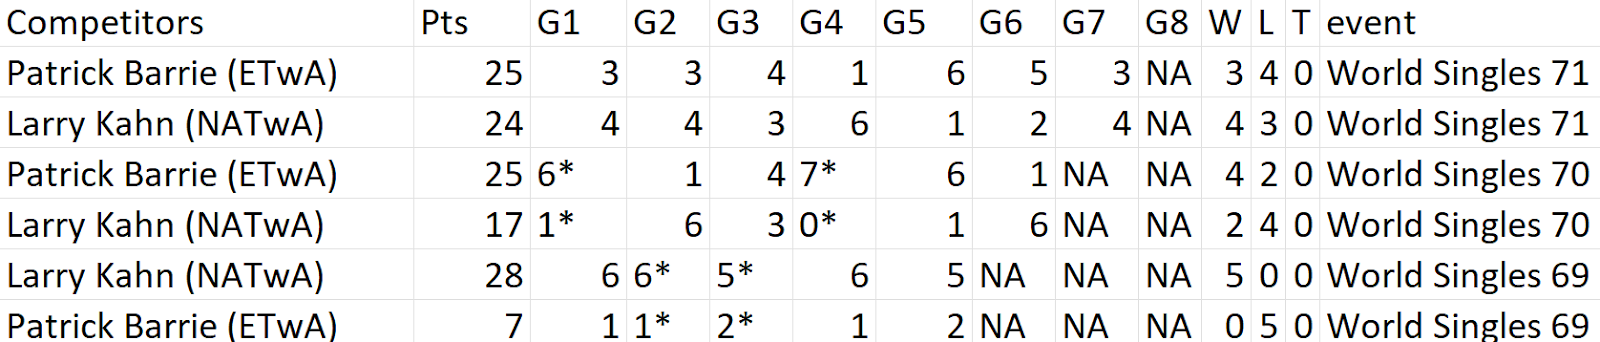
 Challenge by: Will Sutton In this week's Preppin' Data we're collaborating with #GamesNightViz  once more! We're looking at the Major Tiddlywinks Championship results. Before you ask, yes it is a serious game! Here's some terminology you may need to understand part of the challenge:  pot-out or potout • the achievement of having all winks of a color in the pot. Input One input this week taken from the English Tiddlywinks Association  Requirements Input the data Extract the Event id from the Event field Parse the competitor field into Competitor and Association For the first Games Output: Reshape the data so we have a row per Game for each Event id and Competitor Potouts are denoted by a * in the Score field. Add a boolean field to indicate whether there has been a Potout Clean the Score field so that fractions are translated to decimals  e.g. 2½ should be 2.5 For the second Results Output: Remove the Games fields Clean the Points field so that fractions are transla

2022: Week 47 - Solution

Image
Solution by Tom Prowse and you can download the workflow here . This week we look at some unique analysis that I don't think many people would have looked into before! We want to look at the comparison between Chelsea Football Club managers and UK Prime Ministers. A big thank you to  Stephen Moyse  for the challenge! Step 1 - Prime Ministers First we want to focus on the Prime Ministers so will input the table containing the list of Prime Ministers and their duration in office.  Winston Churchill has been split out in 'Winston Churchill' and 'Sir Winston Churchill' so we want to select both of these and group them together. Next, we want to find the Start and End date for each Prime Minister. This is in the Duration field so we need to split these apart into separate fields. Using a custom split, we can use a '-' as a separator and then are left with two new fields (Start Date and End Date): After splitting the duration into separate fields we can rename the

2022: Week 47 - Chelsea Managers per Prime Minister

Image
Challenge by: Stephen Moyse It's been a tumultuous time for UK politics recently, with 3 different Prime Ministers so far this year! Similarly, being a football manager isn't always the most secure a position. So what's the relationship between the 2? Just how many Chelsea Managers have there been for each Prime Minister?  The challenge was a brilliant idea brought to us by data schooler Stephen Moyse and we're excited what other ideas he will bring to us in future! Inputs Prime Ministers  Chelsea Managers  Chelsea Matches  Requirements Input the data For the Prime Ministers data: Group together Sir Winston Churchill and Winston Churchill Split the dates to create Start Date PM and End Date PM For the null End Date PM, replace with today's date Create a row for every day the Prime Minister was in office For the Chelsea Manager data: Remove unnecessary fields and rename remaining fields Clean the Chelsea Managers field For the null End Date CM, replace with today'

2022: Week 46 - Solution

Image
Solution by Tom Prowse and you can download the workflow here .  The challenge this week is to relook at last week's workflow and update it so that it works for multiple regions. For the challenge we have been given multiple inputs so we need to make the workflow dynamic so we can include different regions. Step 1 - Update Input First we want to update the input so that it is the new file containing the 4 different regions. Currently, we only have London, so we can edit the connection and then choose the new file.  We should now have 4 tables - London, Northern, Scotland, and Wales. To include the multiple sheets we can use a wildcard union within the output to include all 4 sheets This might look slightly different depending on what version of Tableau Prep you are using. Finally we can rename Table Names to Region and then remove the File Paths field.  Step 2 - Update Workflow We now need to make a couple of changes to the workflow in order to make sure that we don't have any

2022: Week 46 - Dynamically fixing Table Structures

Image
Challenge by: Jenny Martin The system that created the strange data structure we worked with last week has created more tables in the same structure for other Regions. Luckily we have the workflow we build last week that we can simply edit to work for all Regions. Inputs The workflow we built last week Regional metrics for: London (the dataset we used last week) Northern Scotland Wales Example of London metrics: Requirements Input the data Bring in the data from all the Regions and update the workflow so that no rows get duplicated Output the data Output 5 fields Region Store Date Sales Profit 100 rows (101 including headers) You can download the  full output here .  After you finish the challenge make sure to fill in the  participation tracker , then share your solution on Twitter using  #PreppinData  and tagging  @Datajedininja ,  @JennyMartinDS14  &  @TomProwse1 You can also post your solution on the  Tableau Forum  where we have a Preppin' Data community page. Post your sol

2022: Week 45 - Solution

Image
Solution by Tom Prowse and you can download the workflow here .  The challenge this week is to turn data set that is easy for humans to read into a data set that is easy for Tableau to read. Changing the structure is vital to being able to interrogate the data more effectively and is an important step when learning what the most optimal shape of your data should be. Step 1 - Split Year When we first look at this data set, my initial thought was to use the Data Interpreter however this did quite work as expected so we are going to have to go down a different route. First we want to clean split off the year from the first row. To do this we can filter the F1 field so that we keep only 'Table 1: Store Sales 2022'. From here we only need to keep the F1 field, and then use the following calculation to keep the year: Year   RIGHT([F4],4) Then we can remove F4 and change our year to a whole number. We should now just have a single field with the year 2022. Step 2 - Pivot Rows Now we h

2022: Week 45 - Strange Table Structure

Image
 Challenge by: Jenny Martin This week we're working with a dataset that's very easy for humans to read, not so easy for Tableau. Let's restructure it to make it Tableau friendly. Warning in advance: this may involve creating many separate branches in your work flow! Input In this dataset, we have the Months going along the top of the table. The row below then gives the Sales and Profit measures for that Month.  Requirements Input the data Split off the Year from the first row of data Pivot the remaining rows  Remove the 'F' from all of the F1, F2 etc field names so we have row numbers Reshape the data so each row has a Month associated with it Reshape the data so the values fall under either Sales or Profit Create a Date field using the Month and Year fields Output the data Output 4 fields Store Date Sales Profit 40 rows (41 including headers) You can download the  full output here .  After you finish the challenge make sure to fill in the  participation tracker , t

2022: Week 44 - Solution

Image
Solution by Tom Prowse and you can download the workflow here . The challenge this week is looking at creating unique identifiers by combining fields and creating them with calculations. Step 1 - Merge Order Dates After inputting our data we want to ensure that we have a since column for our order date. Currently, this is split over three different fields so we want to merge these together.  First we need to ensure that all of the fields are a Date. This will allow us to then merge the fields selecting all three (holding down ctrl if you are using a Windows machine) then right click and select 'Merge'  After the merging our table will look like this:  Step 2 - Customer Initials We can now start to create the unique identifier using the fields that we have in our data set. The unique identifier is made up of:  - Customer Initials - Order Number - 0's in between First we can create the initials. As we have a single field that contains both First and Last name we first need to