Posts

Showing posts with the label pivots

2022: Week 21 - Multi-sheets of Madness
Image
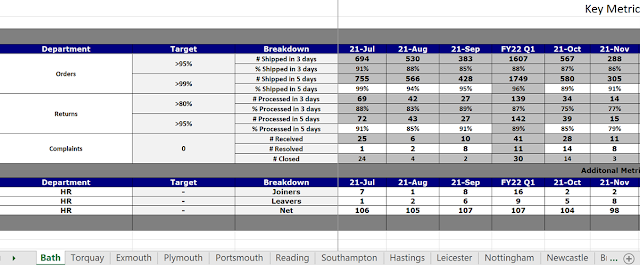
 Challenge by: Jenny Martin We're returning to Chin & Beard Suds Co for this week's challenge. It's inspired by a real data structure, which needed some cleaning before connecting to Tableau Desktop.  Inputs There are 12 sheets from different shops reporting the Key Metrics that we are interested in. There are Additional Metrics in a table below that are not of interest to us for this challenge.  Requirements Connect to the data Bring together the Key Metrics tables from each Shop You'll notice that we have fields which report the quarter in addition to the monthly values. We only wish to keep the monthly values Reshape the data so that we have a Date field For Orders and Returns, we are only interested in reporting % values, whilst for Complaints we are only interested in the # Received We wish to update the Breakdown field to include the Department to make the Measure Name easier to interpret We wish to have a field for each of the measures rather than a row per m...

2022: Week 18 - Un-pivoting

Image
 Challenge by: Jenny Martin Have you ever been given a datasource to work with which has already been lovingly "cleaned" and turned into a pivot table? Whilst that's very kind of the provider, it's not exactly ideal for Tableau Desktop! Let's work to un-pivot such a table from a stakeholder at AllChains! Input A 145 (!) field pivot table: Requirements Input the data Dynamically rename the fields so that there is a common separator between the Bike Type, Date and Measure Name Pivot the data Split out the Bike Type, Date and Measure Name Create a field for Sales and Profit Output the data Output 5 fields Bike Type Region Month Sales Profit 288 rows (289 including headers) You can download the  full output here .  After you finish the challenge make sure to fill in the  participation tracker , then share your solution on Twitter using  #PreppinData  and tagging  @Datajedininja ,  @JennyMartinDS14  &  @TomProwse1 You can also post your s...

2021: Week 36 - What's Trendy?

Image
 Challenge By: Jenny Martin For this week's challenge, I wanted to use Google Trends to take a look back over the past couple of years and see what people were searching for. In particular, are these categories still as popular now as they were in peak lockdown? How does the experience vary around the world? We'll be looking at: Pet adoption (who didn't want a furry work from home buddy?!) Online streamer (can one make money from playing video games?) Staycations (everyone's favourite word, right?) Inputs There are 2 inputs this week: Timeline - indexes for how popular the term is  Country Breakdown - the percentage of these terms popularity in each country  Requirements Input the data Calculate the overall average index for each search term Work out the earliest peak for each of these search terms For each year (1st September - 31st August), calculate the average index Classify each search term as either a Lockdown Fad or Still Trendy based on whether the average inde...

2020: Week 43

Image
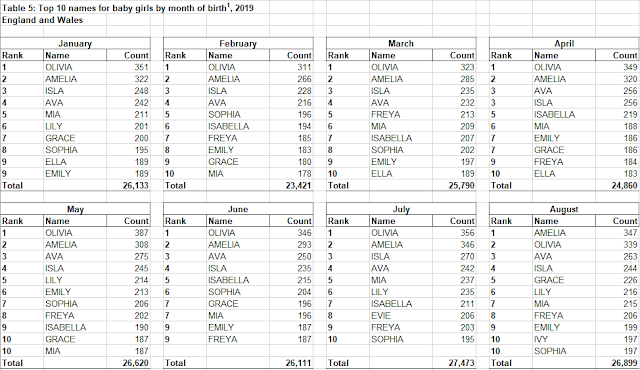
Challenge by: Jenny Martin Sometimes when researching one Preppin' Data idea, you encounter a rather hideous data structure that makes you wonder, "could Prep handle this?" Suddenly you're on a completely different tangent to the challenge you were originally planning and you've got a chunky Prep workflow that just begs to be turned into a challenge itself. So here we are, looking at the most popular baby names for boys and girls in England and Wales in 2019.  Inputs The data itself comes from the Office for National Statistics : Download inputs There is one input for boys names and one input for girls names. As you can see, each month is its own table and they are laid out next to each other in the Excel sheet. Not an ideal input for Tableau Desktop! Pay particular attention to May and August which have additional rows as there have been ties in the rankings.  Requirements Input the data I recommend starting with the boys names Remove totals Pivot to create a mon...

2020: Week 27

Image
Week 27 by Tom Prowse For this week's challenge we are planning a staycation here in the UK, and what better to do than go on a surfing trip! We have identified the area of South Devon, UK as a great surfing area and used the Surf-Forecast website to help us gather some information about each of the surfing sites.   The four of us here at Preppin Data all have a range of skills and requirements for our trip, so can you select the best place for each of us to go? Input 1 Input, 3 Sheets: Information Data from the Surf-Forecast website (and some of our own made-up data!) Location Data about each location, including the best season for surfing Preppers Data about each of our requirements and skill levels Requirements Input Data Find a way to join all three tables together Identify which locations would be suitable for each person Watch out for any duplicated person & site combinations Rank the top sites in terms of rating for each person. If there is a tie, then use the reli...

2020: Week 20

Image
There are a couple of techniques that I use when Preppin' my Data that aren't quite native in Tableau Prep yet. So I'm curious to set a challenge which requires them and see the different work arounds that people come up with! Splitting up a string into individual characters, sometimes referred to as tokenising. Currently you need to have a specific delimiter when splitting a field - what if I wanted to specify the length of each chunk that I want the string to be split into?   Concatenating strings when aggregating. Currently you can only count the values or return the min or the max, but sometimes I'd rather concatenate the multiple values! To play with these techniques, we're looking at ciphers for this week's challenge. You've received an encrypted message and need to decode it using the provided cipher!  Inputs There are 3 inputs this week. You may not need to use all of them, depending on how you approach the challenge. Require...