Posts

Showing posts with the label Split

2022: Week 37 - Elden Ring Adventure

Image
Challenge by:  Will Sutton It's time for another collaboration with  #GamesNightViz ! Over the last few months, the #GamesNightViz team have been playing Elden Ring which has inspired this challenge. We’re looking for the highest damaging weapons we can use throughout our playthrough. Using data tables from https://eldenring.wiki.fextralife.com/Weapons we have the base stats for all the melee weapons however, it’s a little messy!  The goal is to create an output of the highest damaging weapon by its required level. Input A rather wide dataset! Don't worry, it'll be explained in the requirements which fields we need and what the values mean. Requirements Load the dataset  - updated 14/09 Split the dataset into two tables Damage Stats: 1 containing: Name, Category, Phy, Mag, Fire, Ligh, Holy Level Requirements: 1 containing: Name, Str, Dex, Int, Fai, Arc For Damage Stats, if you look at the data in Phy, Mag, Fire, Ligh, Holy: the first value shows the attack damage...

2022: Week 24 - Longest Flights

Image
Challenge by:  Jorge Supelano Have you ever wondered about the longest flights ever taken? Let's prep all the data required to answer that question and build a viz like Jorge's! Find Jorge's viz here Inputs Non-stop flights (top 30, by great-circle distance) - from Wikipedia   World City Latitudes and Longitudes - from SimpleMaps Requirements Input the data Remove the airport names from the From and To fields e.g. New York-JFK should just read New York Create a Route field which concatenates the From and To fields with a hyphen e.g. Dubai - Dallas Split out the Distance field so that we have one field for the Distance in km and one field for the Distance in miles Ensure these fields are numeric Rank the flights based on Distance Use a dense rank in order to match the wikipedia page The Scheduled duration is a Date/Time data type. Change this to a string so that we only keep the time element Update the First flight field to be a date Join on the lat & longs for the From ...

2021: Week 38 - Trilogy

Image
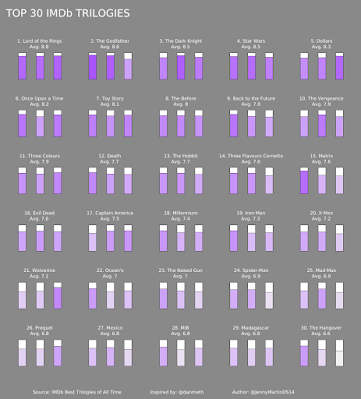
 Challenge By: Jenny Martin Recently, I've been playing with data about the best movie trilogies of all time, according to IMDb. So I thought I'd create a Preppin' Data challenge to allow you all to do the same! View on Tableau Public Inputs There are 2 inputs for this challenge: Top 30 Trilogies  Films  Requirements Input the data Split out the Number in Series  field into Film Order  and Total Films in Series Work out the average rating for each trilogy Work out the highest ranking for each trilogy Rank the trilogies based on the average rating and use the highest ranking metric to break ties (make sure you haven't rounded the numeric fields yet!) We have noticed a slight error in the way that Tableau Prep is calculating this rank, so don't worry if your output is different to ours, we are investigating! Remove the word trilogy from the Trilogy field Bring the 2 datasets together by the ranking fields Output the data Output 7 fields Trilogy Ranking Trilogy Tr...

2021: Week 35 - Picture Perfect

Image
 Challenge By: Jenny Martin Data preppin' ideas really are all around! I was hanging some pictures the other week and I had some weird and wonderful sizes, so working out the perfect frames was a bit tiresome. If only I could use a data preppin' tool to speed up the process...  Inputs We have 2 inputs this week: Picture sizes  Frame sizes    Requirements Input the data Split up the sizes of the pictures and the frames into lengths and widths Remember an inch is 2.54cm Frames can always be rotated, so make sure you know which is the min/max side See which pictures fit into which frames Work out the area of the frame vs the area of the picture and choose the frame with the smallest excess Output the data Output 4 fields Picture Frame Max Side Min Side 14 rows (15 including headers) After you finish the challenge make sure to fill in the  participation tracker , then share your solution on Twitter using  #PreppinData  and tagging  @Datajedininja...

2021: Week 16 - The Super League

Image
Challenge by Tom Prowse If you are a fan of football or have been following any of the latest news then you would have probably heard about the proposed new 'Super League' that was planned with a selection of European clubs. This would have involved a group of 12 teams playing in a competition each year without having to qualify or be relegated. The lack of  fair competition between other clubs has caused an uproar among fans, players, media outlets, football associations, and even the UK government!  The 'big 6' English teams to propose the Super League were Arsenal, Chelsea, Liverpool, Manchester United, Manchester City, and Tottenham Hotspur. One of the ideas to try and discourage the clubs from proceeding with the new league, was to threaten the English teams with being expelled from the English Premier League. The challenge this week is to try and understand how the current league table would change if these clubs were to be 'kicked out'. Inputs  The input ...

2021: Week 14 - Prep Air In-Flight Purchases

Image
Challenge by Tom Prowse We are revisiting our Prep Air Airline this week by looking at some flight details and trying to provide some data driven answers. As part of running an airline we are always interested in how successful the in-flight service is and if we can make any improvements to try to boost sales.  For this week's challenge we have been provided with a selection of different data sources and we want to combine them to answer some questions that will help us to understand some purchasing patterns on the flights.  We have the following inputs :  Passenger List A list of all the passengers from a selection of flights. This includes their name, a passenger number, the flight number and the total they purchased whilst on the flight. Note, not all flights are full and can hold a maximum of 120 passengers.  Seat List A mapping of where each passenger sits within each flight. This is the same for all flights across our fleet and includes the row number and seat ...

2021: Week 11 - Cocktail Profit Margins

Image
Challenge by Vivien Ho (@vivienho22)   This week's challenge has been put together by Vivien to challenge a lot of the fundamental prep skills you have built up so far this year. Vivien's challenge is looking at cocktail pricing (a common trend over the years at Preppin' HQ) and whether you can determine how much profit you can make from certain cocktails because who doesn't talk about data preparation when you are in a bar? Input Cocktails: names, prices and their recipe with measurements Sourcing: ingredient prices, quantity per bottle, currency of price  Conversion rates: currencies and their conversion rates (e.g. 1.14 euros = 1 pound)  Cocktails Sourcing Conversion rates Requirements:  Input the dataset Split out the recipes into the different ingredients and their measurements Calculate the price in pounds, for the required measurement of each ingredient Join the ingredient costs to their relative cocktails Find the total cost of each cocktail  Include...

2021: Week 7 Solution

Image
Solution by Jonathan Allenby and you can download the  full workflow here .  This week in Preppin' Data we were highlighting the slightly confusing and inconsistent world of vegan shopping. A world where Sweet Chilli crisps, Tesco jam doughnuts, and Kellogg's Crunch Nut Clusters aren't vegan but somehow Bacon Rasher crisps, Co-op jam doughnuts, and Cookie Crisp cereal are somehow. Perhaps most enlightening of all however is that Jammie Dodgers use raspberry flavoured apple jam instead of just using raspberry jam. What a world. Step 1 - Prepare the keywords In order to check whether each product contains any of our non-vegan keywords within their ingredients we're going to take every keyword and E number and place them into a single field, one keyword per row, and append them to the list of products. Prepare the E Numbers There's a few different ways and points where you could attach an 'E' to the start of every number. One great way that we used was to use t...

2021: Week 7 - Vegan Shopping List

Image
Challenge by: Jonathan Allenby Now that Veganuary has come and gone we thought it would be interesting to take a look at some common supermarket products and use Prep to figure out whether or not they are vegan. Some results may surprise you! For the sake of this analysis we're taking bee by-products as non-vegan (beeswax, honey, etc). Inputs A shopping list of products and their ingredients (or allergens when ingredients were not available). I have a child-like palate so its mostly full of sweet treats, some of which you'd expect to be vegan and some of which you'd expect not to be, however everything is commonly found in UK supermarkets so no specialist shops required. Two lists of common non-vegan ingredients and E numbers ( source ) Requirements Input the data Prepare the keyword data Add an 'E' in front of every E number. Stack Animal Ingredients and E Numbers on top of each other. Get every ingredient and E number onto separate rows. Append the keywords onto t...

2020: Week 40

Image
Challenge by: Jenny Martin I often see dashboards and wonder about the data prep behind them. Sometimes the most beautiful of dashboards can be hiding the most horrendous of data preparation. Let's take this Viz of the Day from dataschooler Matthew Armstrong . The visualisation itself is fairly simple, but how did the data start off?  Explore Matthew's viz here Inputs There are three inputs this week: The poems, scarped from everypoet.com The Scrabble scores for each letter (Optional) Scaffolding list Requirements Input the data Lines of the poem will not contain any HTML, css or js e.g. <head>, e9=new Object() etc. Filter out any rows which are not lines of the poem Wordsworth is very original, so there shouldn't be any duplicate lines in our data set. Filter out any repeated rows The first line of each poem is also the title of the poem. Ensure this is the case and number the lines of each poem Split the data out so there is a line for each word and assign a word ...