Posts

Showing posts with the label 2021

2021: Week 51 - Departmental December - IT

Image
 Challenge by: Jenny Martin It's the IT department's turn to receive our help this week. Rather than optimising the data for feeding into a data visualisation tool, we're going to think about how to optimally store data. In particular, we're going to be thinking about breaking a dataset down into fact and dimension tables.  In many challenges, we focus on bringing datasets together that have a common ID field. Databases will often follow a star schema, where each dimension is a separate table that can join onto the main fact table. We have received the following desired schema from IT: Input We have one large table to break down into the desired fact and dimension tables: Requirements Input the Data Split out the store name from the OrderID Turn the Return State field into a binary Returned field Create a Sales field Create 3 dimension tables for Store, Customer and Product When assigning IDs, these should be created using the dimension and minimum order date fields so ...

2021: Week 50 - Departmental December - Sales

Image
Challenge By: Jenny Martin Uh-oh, looks like the Sales Team at AllChains have gone rouge with their trackers again. They can't even maintain consistency month to month! And what's the idea with having the Salesperson names at the end of each month?  This challenge was inspired by a dataset my colleague Ollie  encountered, except that dataset didn't have a RowID. If you think of a way to solve this challenge without a RowID we'd love to hear about it! Inputs October Tracker: November Tracker: Requirements Input the data Fill in the Salesperson names for each row (the name appears at the bottom of each monthly grouping) hint Bring out the YTD information from the October tracker and use it to create YTD totals for November too Reshape the data so all the bike types are in a single column Output the data Output 5 fields Salesperson Date Bike Type Sales YTD Total 915 rows (916 including headers) You can download the  full output here .  After you finish the challenge mak...

2021: Week 47 - Games Night Viz Collab

Image
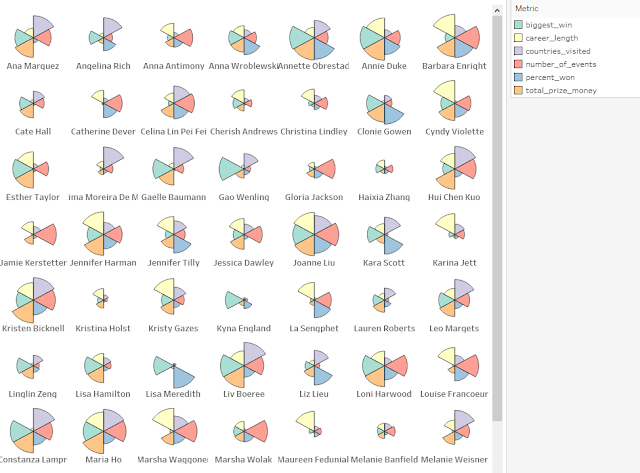
 Challenge By: Will Sutton Did you see the launch of #GamesNightViz a couple of weeks ago? It's a new community project which gives you the opportunity to practise your data visualisation, design and preparation skills. So we've decided to team up this week to bring you a #GamesNightViz style Preppin' challenge!  This week's challenge is about building new dimensions from #GamesNightViz's Top Female Poker Players data to better understand their successes across their poker careers. They've earned millions of dollars but was it all in one go? How many years have they been playing poker? How regularly do they win?  The resulting dataset will allow you to build a pizza plot/coxcomb chart like below, which you're welcome to do as a bonus challenge too! Inputs Top 100 Female Poker Players  Top 100 Poker Events  Requirements Input the Data Add the player names to their poker events Create a column to count when the player finished 1st in an event Replace any nul...

2021: Week 45 - Spread the Knowledge for TC

Image
 Challenge by: Jenny Martin Tableau Conference 2021 is here and we thought we'd put together a challenge themed around Brain Dates to celebrate! The idea is, how many people will you indirectly gain knowledge from as you attend brain dates? The people you're meeting with will have been to other brain dates across the conference, so they will be able to share their key insights and the collective knowledge will grow with every brain date held! I had a lot of fun putting this challenge together, even needing pen and paper at times to work out the final output, so I hope you'll enjoy putting your Preppin' skills to the test with this challenge too.  Inputs The brain dates for each day are spread across 3 excel sheets:  There is also an Attendee ID Lookup table contained within this excel workbook:  Requirements Input the Data Create a DateTime field for each Session Create a row for each Attendee and Join on the Lookup Table Create a Direct Contact Field for each Attend...

2021: Week 43 - Is that the case?

Image
 Challenge by: Beth Kairys A couple of weeks ago, at the Tableau Prep User Group, co-leader Beth Kairys presented a brilliant workflow which covers a lot of the fundamentals of data prep. Luckily, she agreed to allow us to turn it into a Preppin' Data challenge, thanks Beth! If you missed the session or want a sneaky peak at the solution, then click here to watch the user group recording. The purpose of the challenge is to get our cases data into a format where we can reproduce the following chart (which you're welcome to do as a bonus exercise too!) Inputs There are 3 inputs for this challenge: Business Unit A cases  Business Unit B cases  Risk Level lookup table  Requirements Input the data From the Business Unit A Input, create a Date Lodged field Use the lookup table to update the risk rating Bring Business Unit A & B together We want to classify each case in relation to the beginning of the quarter (01/10/21): Opening cases = if the case was lodged before...

2021: Week 41 - Southend Stats

Image
Challenge by: Jenny Martin I was talking to a friend the other day who is a big football fan, but unfortunately their team hasn't been doing too well in recent years. They support a local team called Southend United and my ears pricked up when he claimed they've only won 18 games in the last 108 that they've played. My initial intention with this challenge was to investigate this claim, but instead I stumbled upon historical data which I though might help him to feel a little better and remember the good times. Input We're using the Football Club History Database  for our data this week: Requirements Input the data Rename the penultimate column from P 1 (as it appears in Prep) to Pts Exclude null rows Create a Special Circumstances field with the following categories Incomplete (for the most recent season) Abandoned due to WW2 (for the 1939 season) N/A for full seasons Ensure the POS field only has values for full seasons Extract the numeric values from the leagues F...

2021: Week 40 - Animal Adoptions

Image
 Challenge By: Jenny Martin I'm sure if we took a poll, there would be a large number of us who have become pet owners in the past couple of years. I myself have become the owner of a little kitten called Pyrrha.  It got me wanting to play with some pet data and I came across Austin Animal Center. They claim  over 90% of animals entering the center, are adopted, transferred to rescue or returned to their owners, which is impressive and a statistic we can validate for ourselves! Input Feel free to grab your own up to date data from the link above, or use this extract that we have downloaded: Requirements Input the data Remove the duplicated date field Filter to only cats and dogs (the other animals have too small a data sample) Group up the Outcome Type field into 2 groups: Adopted, Returned to Owner or Transferred Other Calculate the % of Total for each Outcome Type Grouping and for each Animal Type Output the data Output 3 fields Animal Type Adopted, Returned to Owner o...

2021: Week 39 - Painting Bikes

Image
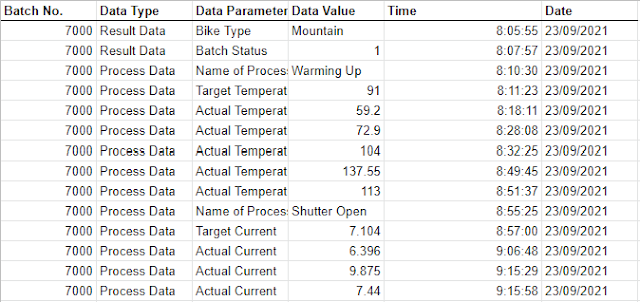
Challenge by Tom Prowse.  This week we make a return to our Bike store but this time we are looking at the painting process within the factory. The factory has a process where different bikes go through a process to be painted and the engineers are provided with some indicator values as the process progresses. It is vital that the engineers are able to track these indicators so they can keep an eye on whether the process is hitting it's target or there are any potential problems.  The data is currently provided in a bit of an unfriendly way with all of the parameters being in a single column. Data is also only provided when a value changes, therefore we should assume that the process value is the same as the previous value until it is updated later in the process. In order to get some value from the data set we need to change the structure and do some cleaning before we can visualise this with Tableau Desktop.  From the data set the engineers would like to have some infor...

2021: Week 38 - Trilogy

Image
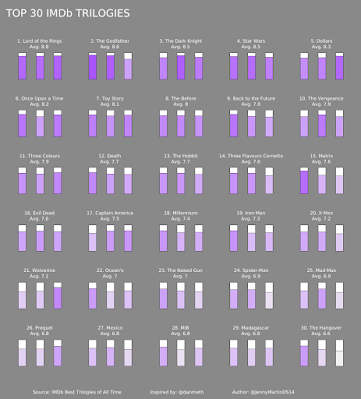
 Challenge By: Jenny Martin Recently, I've been playing with data about the best movie trilogies of all time, according to IMDb. So I thought I'd create a Preppin' Data challenge to allow you all to do the same! View on Tableau Public Inputs There are 2 inputs for this challenge: Top 30 Trilogies  Films  Requirements Input the data Split out the Number in Series  field into Film Order  and Total Films in Series Work out the average rating for each trilogy Work out the highest ranking for each trilogy Rank the trilogies based on the average rating and use the highest ranking metric to break ties (make sure you haven't rounded the numeric fields yet!) We have noticed a slight error in the way that Tableau Prep is calculating this rank, so don't worry if your output is different to ours, we are investigating! Remove the word trilogy from the Trilogy field Bring the 2 datasets together by the ranking fields Output the data Output 7 fields Trilogy Ranking Trilogy Tr...

2021: Week 37 - Re-looking at Phone Contract Revenue

Image
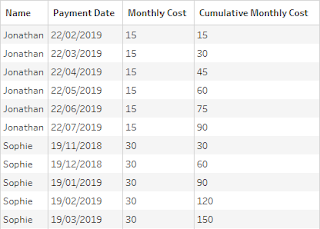
Challenge by Tom Prowse The latest version of Tableau Prep was released this week! This included a great new feature that allows you to generate new rows that aren't already available within your data set. If you want to know more then check out Carl's blog post where he has this covered! As there's a new feature that makes our lives that little bit easier, I thought it would be a great opportunity to revisit one of the older challenges to see how things have changed. Therefore this week we are nearly going all the way back to where Preppin' Data began... Challenge 2019 Week 3!  If you haven't completed this challenge then you can find the original post here , but for the challenge we are going to calculate the recurring revenue based on a mobile phone contract length. This can be completed in the new version of Prep (2021.3 onwards) or an older version if you haven't had the opportunity to download it yet (better yet, why not try both!).  Scenario You work for...

2021: Week 36 - What's Trendy?

Image
 Challenge By: Jenny Martin For this week's challenge, I wanted to use Google Trends to take a look back over the past couple of years and see what people were searching for. In particular, are these categories still as popular now as they were in peak lockdown? How does the experience vary around the world? We'll be looking at: Pet adoption (who didn't want a furry work from home buddy?!) Online streamer (can one make money from playing video games?) Staycations (everyone's favourite word, right?) Inputs There are 2 inputs this week: Timeline - indexes for how popular the term is  Country Breakdown - the percentage of these terms popularity in each country  Requirements Input the data Calculate the overall average index for each search term Work out the earliest peak for each of these search terms For each year (1st September - 31st August), calculate the average index Classify each search term as either a Lockdown Fad or Still Trendy based on whether the average inde...

2021: Week 35 - Picture Perfect

Image
 Challenge By: Jenny Martin Data preppin' ideas really are all around! I was hanging some pictures the other week and I had some weird and wonderful sizes, so working out the perfect frames was a bit tiresome. If only I could use a data preppin' tool to speed up the process...  Inputs We have 2 inputs this week: Picture sizes  Frame sizes    Requirements Input the data Split up the sizes of the pictures and the frames into lengths and widths Remember an inch is 2.54cm Frames can always be rotated, so make sure you know which is the min/max side See which pictures fit into which frames Work out the area of the frame vs the area of the picture and choose the frame with the smallest excess Output the data Output 4 fields Picture Frame Max Side Min Side 14 rows (15 including headers) After you finish the challenge make sure to fill in the  participation tracker , then share your solution on Twitter using  #PreppinData  and tagging  @Datajedininja...

2021: Week 34 - Excelling with lookups

Image
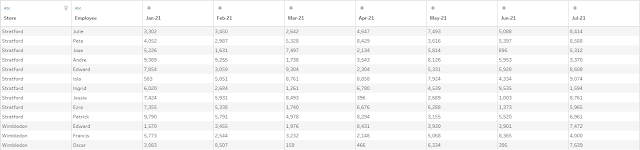
 Challenge By: Jenny Martin As we come to the end of our excel challenges month, it seems only right to think about vlookups and index matches. In Excel, these are great functions for bringing together data from different worksheets without having to manually copy and paste.  Our scenario this week is looking at Employee Sales at Allchains for each month of the year so far and we want to compare this to their Monthly Targets, stored on another sheet. Inputs We have 2 inputs this week: Employee Sales Employee Targets Requirements Input data Calculate the Average Monthly Sales for each employee In the Targets sheet the Store Name needs cleaning up Filter the data so that only employees who are below 90% of their target on average remain For these employees, we also want to know the % of months that they met/exceeded their target Output the data Output 5 fields Store Employee Avg monthly Sales % of months target met Monthly Target 4 rows (5 including headers) After you finish the...

2021: Week 30 - Lift Your Spirits

Image
 Challenge By: Jenny Martin Inspiration for Preppin' challenges can come from anywhere. I've recently moved into a block of flats and let me tell you, I spend a lot of time waiting for a lift (or elevator if you're across the pond). It got me pondering whether the lift is operating optimally. Is it better to stay on the floor that you drop passengers until the next time someone calls a lift, or should the lift return to the most common starting floor? Input There is one input this week, detailing the time of each trip the lift takes, including which floor the passengers enter the lift and which floor the passengers leave the lift.  For simplicity, assume that the lift does not stop mid-journey to pick up new passengers, but completes its current trip before starting a new one. Requirements Input the data Create a TripID field based on the time of day Assume all trips took place on 12th July 2021 Calculate how many floors the lift has to travel between trips The order of flo...

2021: Week 29 - PD x WOW - Tokyo 2020 Calendar

Image
Challenge by Tom Prowse with collaboration with the Workout Wednesday team! This week is time for our annual get together with Workout Wednesday for a joint challenge so that you can have a full data prep to visualisation solution.  Unfortunately the Olympics was postponed in 2020, so for last year's collaboration we looked at historical winners through the history of the games. However, this year, Japan 2020 is going ahead so we thought it would be the perfect time to create an event calendar to help us keep track of the events that we don't want to miss.  Inputs The data comes from the Olympics website . ( Note; this was taken on Wednesday 14th July so the schedule for some events may have changed since! ). You can download the data here .  1. Event Schedule A list of all the event dates, times and locations throughout the games 2. Venue Details A list of all of the different venue locations Requirements Input the Data   Create a correctly formatted DateTime fiel...

2021: Week 28 - It's Coming Rome

Image
 Challenge by Tom Prowse. '55 years of hurt, Never stopped me dreaming!' It was another night of pain for England fans on Sunday evening when they lost yet another penalty shootout in the European Football Championship final. This seems like it has been a common outcome for a lot of the tournaments that England have taken part in over the years, but what does the data agree?  The challenge this week is to analyse the all of the penalty shootouts in the World Cup and European Championships (Euro's) since 1976. Input Data is from Wikipedia ( World Cup & Euro's ) and is two sheets:  World Cup Euro's Requirements Input Data Determine what competition each penalty was taken in Clean any fields, correctly format the date the penalty was taken, & group the two German countries (eg, West Germany & Germany) Rank the countries on the following:  Shootout win % (exclude teams who have never won a shootout) Penalties scored % What is the most and least successf...