Posts

Showing posts with the label 2020

2020: Week 53

Image
Challenge by: Jenny Martin 2020 - what a year! Much has changed, few things have stayed the same. Even our star signs weren't safe! The introduction of a 13th star sign, Ophiuchus, threw things into disarray. Were you born on a day where your star sign has remained unchanged? Let's make a list of all those affected by the changes. Just a quick thank you for those who have stuck with us in 2020, those who joined us in 2020 and all who learnt something new about Prep!  Inputs Old Star Signs and Date Range  New Star Signs and Date Range  Handy Date Scaffold  Requirements Input the data . Be careful your data isn't mistaken for a header. Reshape and clean up the data so you have a column for the star sign, along with the start and end dates. Create a date range for the new star signs. Scaffold the data so you have a row for every date of the year (2020 is a good year to base this off, since it's even a leap year!) For the output, we're looking for a list of dates that h...

2020: Week 52

Image
  Challenge by Tom Prowse. This week's challenge comes from the winner of the Prepstar award at this year's Tableau Conference and member of the SportsVizSunday team - Kate Brown .  Kate recently created a viz all about the history of the USGA Women's US Open but before creating in Tableau Desktop she had to prepare the data in Tableau Prep to make this possible.  In the viz Kate has used Polygons to create a square for each round and each year. So for this week's challenge we are going to see what data prep is required to create polygons just like in the viz! Inputs  There are two inputs:  1, US Open Winners 2, Location Prize Money Requirements Input and Join both data tables. Calculate the total par score and round par score  for each year. The par score is the predetermined number of strokes that a golfer should require to complete a round. The tournament is made up of 4 rounds, with the lowest number of shots being the winner.  Next we need to crea...

2020: Week 50

Image
Challenge By: Jenny Martin Secret Santa is a bit more difficult this year, without everyone being able to gather together and pick names out of a hat. Never fear though, we can randomly assign Secret Santas to their Secret Santees with the Power of Prep! Although we will simplify things a little so the assignments follow a logical rule rather than being completely random, but I'm sure our Secret Santas won't realise. After all, it's supposed to be secret! Input One input of the Secret Santa Participants and their email addresses:  Requirements Input the data Assign Secret Santas to Secret Santees that follow them in the alphabet i.e. Ellie should be the Secret Santa for Emma Since no one follows Tom alphabetically, his Secret Santee should be Ellie, as she is first alphabetically Some of the email addresses contain typos. Clean them up To make life easier, we're planning on automating sending the emails. Create a field for the Email Subject and a field for the Email Bod...

2020: Week 48

Image
Challenge by: Jenny Martin Being an airline, Prep Air has to work closely with airports to ensure its passengers get the best experience possible. One airport in particular has been accused of driving passengers crazy by changing the gate allocations of flights multiple times before boarding occurs. Prep Air has discovered that this is due to the airport using a random number generator to assign gates for flights and manually correcting the errors in real time. Prep Air have been given the opportunity to demonstrate that they have a better way of allocating gates for the airport's busiest time of day. Whilst the stand numbers will still be set by the airport, we can at least ensure the corresponding gates are allocated in a more logical way.  The diagram below should help illustrate which stands can be accessed by which gates. The remote stands (10-12) can be accessed by any gate via a bus. However, passengers don't enjoy the bus rides, so we should try to minimise the time tha...

2020: Week 47

Image
Challenge by: Jenny Martin Prep Air want to do some analysis of flight delays to and from its key destinations. After many discussions with the airport, they finally agreed to share this data. However, it's not in the best structure, so we'll definitely need to do some prep before our analysis can begin. (It's almost like they're afraid of what we'll find!) A special thank you to Michael  this week for sharing a similarly structured dataset with us that sparked the idea for this challenge! Inputs We have 2 inputs this week: Information on the delayed flights, separated across multiple lines Aggregated view of flights which were not delayed Requirements Input the data Aggregate the data so that you have 1 row per flight delay, instead of the current 3 rows Make sure all Airport codes are valid. Group those which are not. Calculate the total delay and number of delayed flights for each Airport, for each journey type Combine with information on flights which were not d...

2020: Week 46

Image
 Challenge by Tom Prowse. At Prep Air, we have decided to do some research into the risks of running an airline. We want to complete some analysis on some historic aviation incident reports so we can try to identify potential areas where we can make our airline safer. We have taken a selection of reports from the AeroInside  website, who document various incident reports from around the world. Each report contains information about the incident, but is a free text field so doesn't really have a structure. In this challenge, we want to parse out the key information from the string, and then see how many incidents occur that are related to our key categories.  Inputs Incident List Category List Requirements Input the Data Parse out the following information from the incident string:  Aircraft - eg, American B738 Location - Amsterdam Date - Apr 21st 2016 Incident Description - details about the incident Convert date field from string to a date Combine similar incident t...

2020: Week 44

Image
Challenge by: Jenny Martin We're getting spooky this week, not only with Halloween data, but also with another click-only challenge! That's right, typed calculations are absolutely forbidden. We've got sales data from a company selling Halloween costumes around the world, but it certainly needs a little tidying up. With their fiscal year coming to an end on Halloween itself, they want to see how their sales are comparing to last year's. Let's hope the results aren't too scary! Input There is one input this week, containing Halloween costume sales from different countries:  Requirements Remember this is a click-only challenge, no typed calculations allowed! (Although you may rename fields, we're not that harsh)  Input the data. Each costume is in the language of the country the sales occur in. Group these costumes together by their English translation. You should have 9 costumes once you've finished grouping There have been some errors when inputting cou...

2020: Week 43

Image
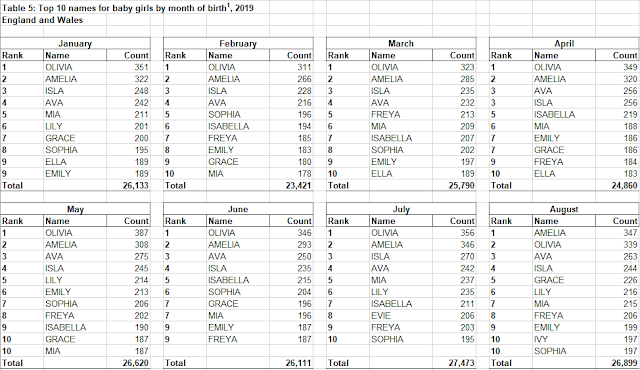
Challenge by: Jenny Martin Sometimes when researching one Preppin' Data idea, you encounter a rather hideous data structure that makes you wonder, "could Prep handle this?" Suddenly you're on a completely different tangent to the challenge you were originally planning and you've got a chunky Prep workflow that just begs to be turned into a challenge itself. So here we are, looking at the most popular baby names for boys and girls in England and Wales in 2019.  Inputs The data itself comes from the Office for National Statistics : Download inputs There is one input for boys names and one input for girls names. As you can see, each month is its own table and they are laid out next to each other in the Excel sheet. Not an ideal input for Tableau Desktop! Pay particular attention to May and August which have additional rows as there have been ties in the rankings.  Requirements Input the data I recommend starting with the boys names Remove totals Pivot to create a mon...

2020: Week 42

Image
 Challenge by Tom Prowse This week we are back in the (home) office after a week at Tableau Conference-ish and want to know how we are performing so far this year. As for most businesses, it's been a tough year so we want to find some comparisons between our sales this year, last year and our targets.  We have two inputs:  1, Transactions This is a list of our daily sales for each product. It contains the Price, Quantity and Income.  2, Targets This is a list of targets that have been provided by the finance team. It is a weekly breakdown for this year by product. Requirements  Input the Data Create a daily Targets table. Assume there are 7 days in the week and the daily demand is split evenly throughout the week. Eg, if the weekly target is 700, then 100 per day.  Categorise whether a row/transaction happened this year, last year or is a target. Combine the Transactions & Targets tables.  Only keep the Year to Date for each period. As the 9th Octo...

2020: Week 40

Image
Challenge by: Jenny Martin I often see dashboards and wonder about the data prep behind them. Sometimes the most beautiful of dashboards can be hiding the most horrendous of data preparation. Let's take this Viz of the Day from dataschooler Matthew Armstrong . The visualisation itself is fairly simple, but how did the data start off?  Explore Matthew's viz here Inputs There are three inputs this week: The poems, scarped from everypoet.com The Scrabble scores for each letter (Optional) Scaffolding list Requirements Input the data Lines of the poem will not contain any HTML, css or js e.g. <head>, e9=new Object() etc. Filter out any rows which are not lines of the poem Wordsworth is very original, so there shouldn't be any duplicate lines in our data set. Filter out any repeated rows The first line of each poem is also the title of the poem. Ensure this is the case and number the lines of each poem Split the data out so there is a line for each word and assign a word ...

2020: Week 39

Image
Challenge by: Jenny Martin Last week, Jonathan created this amazing viz, allowing you to investigate Pret a Manger's new deal in the UK: Explore the viz here The premise, as explained in Jonathan's viz, is that you can order up to 5 drinks a day, every day, for £20 a month. Unfortunately, the Preppin' Data team have slightly more complex orders than the viz allows you to input. So we'll need to use Tableau Prep to see if the deal is worthwhile for everyone and how much they could save! Inputs There are 2 inputs this week: Orders Price List (based on St Albans 15/09/2020) Requirements Input the Data Restructure the orders so we have a line per person per drink, with a count of how many times they order that drink in a week Remember: extra shots or syrups will have their own prices so should be on a separate row in the data Restructure the price list so we have each item with its price on a separate line Join the ordered drinks to their prices Beware ordered drinks not h...

2020: Week 38

Image
Challenge by Tom Prowse This week we are going to have a bit of fun and taken inspiration from one of the Alteryx Weekly Challenges. For this week's challenge we want to build a workflow that will allow us to identify whether two words are anagrams of each other.  We have selected some words that are related to Tableau Prep & Preppin Data, so can you tell if they are anagrams or not? Input One file with two tables:  1. Words - the list of words to determine whether they are Anagrams or not. 2. Scaffold - this is an optional input to use if you need it! Requirements Input the Data Determine whether the words are Anagrams. There are the following rules:  Anagrams are formed by re-arranging of another word (on the same row) All anagrams are one word only No letter can be used more than once All letters must be used Output Data Output One Table:   Three Fields Word 1 Word 2 Anagram? 12 Rows (13 including headers) After you finish the challenge make sure to fill in t...

2020: Week 37

Image
Challenge by: Jenny Martin This week we're tackling some questions commonly asked by clients: How do I calculate working days in Tableau Prep? or Is there a networkdays function in Tableau Prep? Commonly, clients are looking to calculate the number of working days between the open and closing date of support tickets, to see if they're complying with their SLAs.  However, I thought we'd choose something a bit more fun for the challenge this week! Instead, let's work out how many days you've worked in a specific time period. This could be since you got your first "proper" job, since you started working for your current employer, days you've worked this year - anything you like! Inputs The inputs will need to be a little bespoke for this challenge. You will need: An input containing the date you'd like to start counting from An input containing information about the number of days holiday you took each year A bank holiday input for your country of r...

2020: Week 35

Image
Challenge by: Jenny Martin This week we're looking at a slightly odd way that Chin & Beard Suds Co have been structuring their store sales and target data:   As you can see, for each Store, there are 3 rows, the first being the Sales values, the second row containing the Target values for each month and the third row containing the difference between these values. It's your job to transform this monstrosity  unique table into a more conventional output that we could use in Tableau Desktop.  Inputs You have 2 options this week: Start the challenge with a Row ID already present (as pictured above) Use this as an opportunity to play with the Script step and create your own Row ID! Our solution will cover the RServe option, but you're welcome to use TabPy instead. For help getting set up with RServe, check out this blog For TabPy, check out this blog by our colleague Brian Scally   Requirements Input the data Make sure Store names have filled down correctly and remo...

2020: Week 34

Image
Challenge by: Jenny Martin This week is a follow on from last week's challenge . Chin & Beard Suds Co execs were very interested in our profitability analysis and want to see if we can make any suggestions for improvement. The first place to start is challenging the assumption that each Scent sells 100 bars a day on average. Once we calculate the actual average sales of each Scent per week, we'll see if ordering based on this figure improves profitability for C&BS Co.  Input All you'll need for this week's challenge is the solution workflow from last week, which can be downloaded here . Requirements Calculate the Average Units Sold each day for each Scent Round this upwards to the nearest whole number Round this to the nearest 10 Multiply this by 7 Use the Average Units Sold as the new Units Ordered value and calculate the Waste (=Units Ordered - Units Sold) in this new scenario For negative values, this means we need to adjust our weekly sales as we would have ...

2020: Week 33

Image
Challenge by: Jenny Martin Since we had so many interesting approaches to Carl's fill down challenge last week, I thought we'd continue the theme of multi-row data prep problems!  This week we're looking at Chin & Beard Suds Co's slightly odd inventory ordering process. Every Wednesday, they restock each scent with 700 new bars. This is working on the assumption that the average sales for each scent are 100 bars a day. Any unsold bars on the Tuesday evening are deemed "not fresh enough" and thrown away.  We've been tasked with finding out how many bars are being wasted due to this process and how much that's costing the company! Inputs We have 3 inputs this week: Daily Sales Input Orders Input Scent Input Requirements Input the data * *Edit 20/08 - Final 3 days in July Removed from Daily Sales Calculate the Units Sold (=Daily Sales/Price) For each week (Wednesday-Tuesday), calculate the Weekly Units Sold and Weekly Sales.  Hint: It may be useful t...