Posts

Showing posts from April, 2023

2023: Week 17 - Population Growth vs Country Size

Image
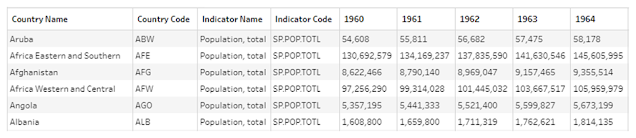
Challenge by: Serena Purslow We have a guest contributor this week! Serena is from DS36 at the Data School and passionate about working with Environmental, Social and Governance (ESG) data. This challenge uses data directly from the world bank, but it’s a bit of a mess! The goal is to calculate the change in population per km 2 across the world, to find which countries have seen the biggest increase over the past 21 years.  Inputs World Population Data 1960 - 2021  Country Size Data Requirements Input the data Population data: Use the data interpreter to ensure the headers are read as headers  Remove unnecessary fields Trim leading & trailing spaces from country names Use the Country/Region data role to tidy up country names Pivot data so we have 3 columns for year, population and country name Country size data:  Split the Land in km2 (mi2) field to get the values for land size in km 2  only  Remove unnecessary fields - we only want country and land size km 2 Clean country names

2023: Week 16 - Solution

Image
Solution by Tom Prowse and you can download the workflow here . Following from looking at Easter Sunday dates last week, we are now going to look why there is so much variation with Easter dates and how the moon reflects this. Step 1 - Tidy Full Moon Input First, we want to input the Full_Moon table and rename the fields:  - Day = Full Moon Day - Date = Full Moon Date (make sure this is a Date field type) We can then clean the Time field to match the requirements. First we want to remove all the Numbers and Letters from the field so we are left with only the symbols that represent the different types of moons. Then we want to replace the symbols with the corresponding type of moon as given in the requirements. As a result we should now have the 4 different types of moons in our table:  Step 2 - Include Easter Sunday We can now include the dates for Easter Sunday by joining the Easters table using an inner join where Full Moon Date <= Easter Sunday:  Now we have both tables together

2023: Week 16 - Easter and Full Moons

Image
Challenge by: Jenny Martin In a continuation from last week, my curiosity continues! Why is there so much variation in when Easter Sunday falls?  "The simple standard definition of Easter is that it is the first Sunday after the full Moon that occurs on or after the spring equinox. If the full Moon falls on a Sunday then Easter is the next Sunday." - Royal Museums Greenwich Let's compare our Easter dates from last week with the Full Moon dates to see if this is true.  Inputs The output data from last week's challenge  Historical Full Moon dates . Note: this only goes back to 1900 rather than 1700. Our analysis for this challenge will be between 1900 and 2023  Requirements Input the data Rename the Full Moon fields From the Time field, parse out the interesting info the full moons [+] Blue moon (second full moon within one calendar month) [*] A partial lunar eclipse takes place [**] A total lunar eclipse takes place Join with Easter Sunday Dates Make sure we only inclu

2023: Week 15 - Solution

Image
Solution by Tom Prowse and you can download the workflow here .  Step 1 - Dates After inputting the data we first want to focus on the dates on the x-axis.  Within the table we can filter on F2 and keep only null values, then in F3 we can exclude all the null values. This will help us to have the month and day combinations so we can then use a rank calc to create a row id field. At this stage our table should be wide with a separate field for each day:  From here we can then pivot the data by using a wildcard pivot of all the 'F' fields: Then pivot it back the other way using the Row field and the Max of F:  Then rename the Pivot Names to Colum, 1 to Day, and 2 to Month.  Within the Month field we want to remove any spaces so that we have a string with each of the month names.  Then we want to fill in the null values with the correct month.  First we can duplicate the column field, and then remove all letters from the field. This leaves us with a whole number and we can rename

2023: Week 15 - Easter Dates

Image
Challenge by: Jenny Martin Each year there's the inevitable Google as to what day Easter Sunday will be (usually multiple times, let's be honest!) But what's the most popular date? I found a great viz to give us that answer, but what if I want the underlying dataset behind it? Input I downloaded this beautiful viz from  Thomas Larsen , and yes, it is built in Excel. Top Level Requirements Input the data Reshape it so that we have a list of Easter Sunday dates Filter the dataset so that we only have past dates i.e. 1700 - 2023 Output the data More Detailed Requirements Input the data Split the data into the years and the x-axis of the chart i.e. the day and month For the years, make sure there is a row per year and keep the generated column name field i.e. F1, F2 etc. For the day and month rows, number them Pivot so we have a row per day/month Pivot so we have the days in one field and the months in the other Still keeping the generated column name field Fill down the month

2023: Week 14 - Solution

Image
Solution by Tom Prowse and you can download the workflow here .  Now that we have completed our themed weeks for the start of the year, we now have Alfred Chan  bringing us a challenge all about World Trade data. We are using publicly available data from the World Integrated Trade Solutions to examine the trade data across countries. Step 1 - Input Country Data First up we want to input the data for each of our countries using the 'Union multiple tables' option within the input step.  We want to add all of the CSV files from the folder so we can select 'Union Multiple Tables' option from the Tables tab. Then we also need to ensure that Prep is reading in the first row as a header, therefore we need to make sure that is selected from the 'Settings' tab:  Settings Tables Once we have input all of the tables we can make sure that the Reporter and Partner fields have the Country/Region data role so the table should look like this:  Step 2 - Country Codes Next we wan

2023: Week 14 - World Trade Data

Image
Created by: Alfred Chan We've got a guest contributor this week! Alfred is part of DS28 at the Data School. In this week's Preppin’ Data Challenge you are required to examine and compile a report on all countries’ trading data. The report should contain information of the import and export data.  Another request is to make sure the import and export can be visualised on a map so some additional spatial data is needed. We are going to use a public data from the World Integrated Trade Solutions to examine the trade data across countries. Link to the website: https://wits.worldbank.org/datadownload.aspx?lang=en    Inputs World Trade Data, one csv file for each country  Countries Geographic Data (original data from here ) Requirements Input the world trade data, pull in all countries’ files Make sure Prep reads the first line of the file as header Update the data role of the Reporter and Partner fields from string to Country/ Region (some countries will not be recognised, but we w

2023: Week 13 - Solution

Image
Solution by Tom Prowse and you can download the workflow here .  This is our final week of the advanced challenges and themed months to start off the year. Hopefully, you have been able to develop your skills each week and now have some top techniques to use in your own analysis. The challenge this week focusses on moving averages within Tableau Prep. This isn't a native feature so we have to get a little creative to solve this type of problem. Let's look at how it can be done! Step 1 - Input Data First, we want to input the data from all of the different CSV files within the folder. This contains all of the information for each month so we want to utilise the wildcard union to bring all of these together into a single input.  After using the wildcard union, we can then clean the table by removing first_name, last_name, Ticker, Market, Stock Name, and Market Cap fields.  Then from the File Paths field (this is created by the wildcard union) we can remove all letter and punctuat