Posts

Showing posts with the label wildcard union

2022: Week 46 - Dynamically fixing Table Structures
Image
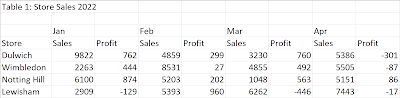
Challenge by: Jenny Martin The system that created the strange data structure we worked with last week has created more tables in the same structure for other Regions. Luckily we have the workflow we build last week that we can simply edit to work for all Regions. Inputs The workflow we built last week Regional metrics for: London (the dataset we used last week) Northern Scotland Wales Example of London metrics: Requirements Input the data Bring in the data from all the Regions and update the workflow so that no rows get duplicated Output the data Output 5 fields Region Store Date Sales Profit 100 rows (101 including headers) You can download the  full output here .  After you finish the challenge make sure to fill in the  participation tracker , then share your solution on Twitter using  #PreppinData  and tagging  @Datajedininja ,  @JennyMartinDS14  &  @TomProwse1 You can also post your solution on the  Tableau Forum  where we ...

2021: Week 4

Image
This is the last in the 'Starter Challenges' series to get you up and Preppin' to start the new year. We've enjoyed running this mini-series so much we're already looking at creating another similar series later in the year.  This week's challenge involves picking up some more of the fundamental skills and gives you some chances to practice some of the skills you've picked up over the last few weeks. As always, we'll be guiding you along the way with some useful help links if you need a couple of reminders or chance to explore those new techniques.  The new technique for you to learn this week is Joins. If you've worked with different data solutions for a number of years, you'll be familiar with Joins but if you are new you're in for a treat! Joins allow us to bring two data sources together. This allows for much easier, richer and deeper analysis as data is often in many different locations. Use the help links if this is a new technique for ...

2021: Week 3

Image
This week is the third in the Starter Challenges series we are running to kick off 2021.   This challenge will introduce you to the two main types of reshaping data, pivoting and aggregation. We used aggregation last week so we are building on this technique this week. We will also let you work with Unions where we stack data sets that have similar structures on top of each other.  As with all of our January 2021 challenges, we will be sharing useful links to helpful videos and articles that will give you more technical support if you need it.  This week's challenge sees us looking at the Accessory Sales at our Bike Store. Input One Excel sheet with 5 tabs of data: London Leeds York Manchester Birmingham The structure of the data is the same in each worksheet.  Requirements Input the data source by pulling together all the tables ( help ) Pivot 'New' columns and 'Existing' columns ( help ) Split the former column headers to form: ( help ) Customer Type Product Ren...

2020: Week 8

Image
Hello Preppers, we often get asked what is a nice way to start learning how to use Tableau Prep Builder. This exchange happens a lot in the Tableau Prep community... So I thought it was time to create another, CLICK ONLY (and changing some column titles) solution so people can explore the functionality in Prep. Remember to show you are taking part by filling in the participation tracker  which due to Rosario's idea on keeping track of level of complexity, we should soon have a view on difficulty of each challenge too. The challenge this week is pulling together multiple weeks worth of data that get added by an additional worksheet being added to an Excel Workbook. But, all the files to reference needed to be added in to context using a different spreadsheet (in the same workbook) from our Financial Planner, Jules. Jules loves a spreadsheet and hasn't gotten used to these "modern data tools things". Jules' data source is a mess - it's your job to turn it...

2019: Week 45

Image
Data is everywhere and often in annoyingly small files that we need to piece together before we can begin analysis; Chin & Beard Suds Co is no different. This week's challenge is to piece together data we have received from our Clapham and Wimbledon stores. We've heard there are lots of differences between our two stores in South West London for Sales Volumes and Values. We've heard there are duplicates in the dataset so help us remove these as the entries are the same, just doubled up due to some reporting issues. Requirements Input all Data Files Remove Duplicates (identical rows) Work out the percentage of: Scent sales per Store's Total Sales Values and Volumes Weekday sales per Store Total Sales Values and Volumes Replace Weekday with full date Output Data Output Two Files: 1. Scent  - 20 rows (21 rows including headers) - 4 columns: Store  Date Scent % of Store Sales Volumes Scent % of Store Sales Values 2. Weekd...

2019: Week 15 Solution

Image
You can view our solution workflow below and download it here . Full solution workflow. There are 3 main learning objectives for this week's Preppin' Data challenge: Using "Wildcard Unions" & file paths. Using aggregations to calculate "percent of total" fields. Creating Filter calculations. Unioning the data and getting the regions We’ve got five CSVs, one for each region, and all of them have the same data structure – sounds like a call for a Wildcard Union input! Instead of inputting each file separately we can: Applying a Wildcard Union Add one of regional stock files to the canvas. Switch to the Multiple Files tab. Select Wildcard Union . If they share a folder with other files, define a “ Matching Pattern ” of “* Stock Purchases.csv”.  This means only  files that end in “Stock Purchases.csv” will be imported into the union. Click Apply . From here, Tableau Prep automatically unions all the data together for yo...