2023: Week 26 - Prep School 2023 Admissions - Part 2
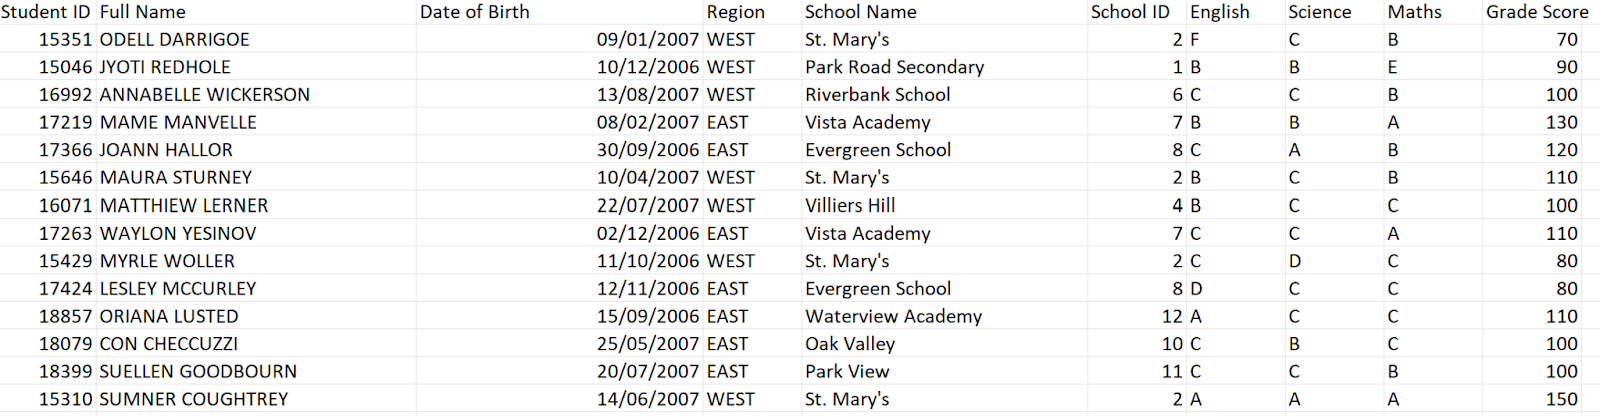
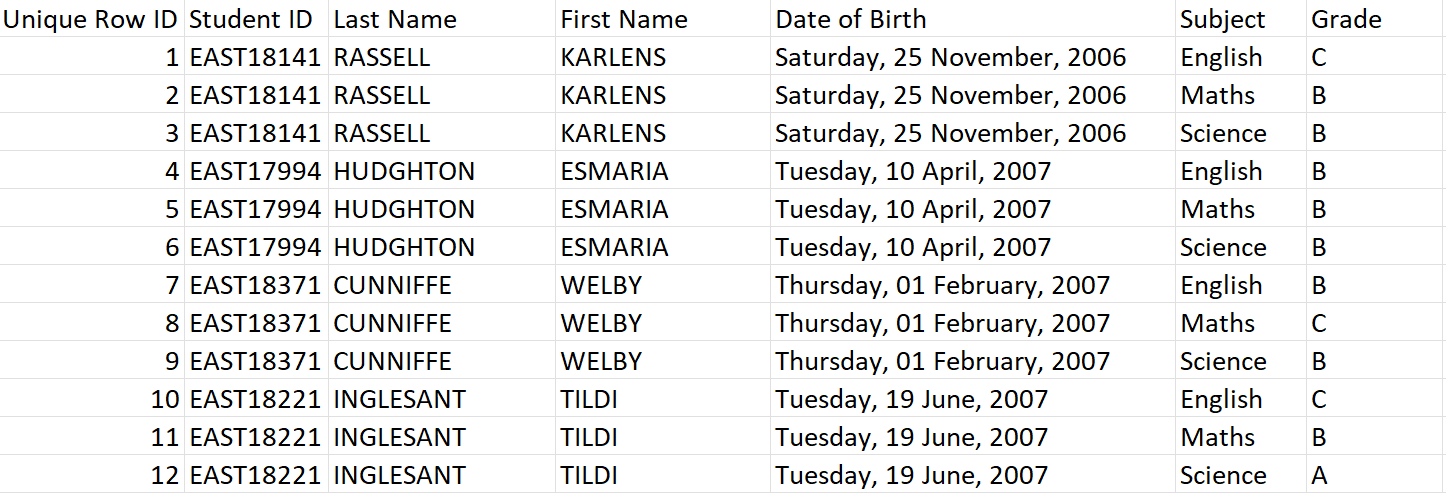
Challenge by: Ross Killington This is our next challenge from one of the members of the 38th cohort of the Data School UK, and it's a follow on from last week! After last week's challenge we now have a useful table populated with 4,000 students applying to the Prep School with their respective grades and total scores. This week however it’s crunch time, we need to decide which students will be accepted into the school for the new academic year. We are supplied with some new data relating to the students including which course they want to study, as well as details about their address and proximity to the school. Prep School offers 5 courses: Business Management Computer Science Psychology Engineering Data Analytics Each course can take 20 students, usually it would be a half and half split between students from each region but this year due to a population imbalance we have been asked to accept a split of 75% East Students and 25% West Students on each course. To...