Posts

Showing posts from January, 2020

How to...Join Datasets together

Image
Whether your data comes from Files, Databases or both, mastering Joins will be a key skill to learn. Joins are required as most software requires one large table of data to reference when conducting analysis. As data will come from a lot of different sources, being able to combine these is key. Data sources are joined together to allow the user to take columns from each data source and use them alongside each other in the output. For this post, the examples will use the 2019 Week 29 inputs  except the initial Join Condition example. Join Logic and Terminology The majority of data software uses similar logic and terminology when joining datasets together. Prep is no different but some of the functionality when joining datasets together is a lot more user friendly than other tools. Here are two tables that we might want to join together for analytical purposes. If we have price, but we don't know how many we have sold, we can't be sure of revenue. Therefore, thes

2020 - Week 4 Solution

Image
The challenge this week was all related to survey data and duplicate values! In this challenge we had to overcome the problem of customer's sharing their opinions multiple times meaning that the results of the Net Promoter Score are incorrect. Step 1: Clean! Our first task is to tidy up some of the fields where the data has been input with different structures. These fields include the Question Number, Country, Store, Dates & Time, and also Ages. Question Number To update the question number we need to join both of the tables together, this is a nice easy step as both tables have a question number field therefore these join nicely with an inner join. We also want all of the questions to be in their own separate column. To do this we can use a Rows to Column pivot on the Question field, then bring through the MIN of Answer: Age The next step is to calculate the age of each of the respondents. This is easier now as we have each response per row, meaning we

2020: Week 5

Image
Rank in Tableau Prep still isn't as easy as it could be. The Prep Development team have been hard at work and will come up with a solution soon so it's the final chance to try to solve how to do a Standard Competition rank in Prep. What is Standard Competition ranking?  This form of Rank is actually the default rank within Tableau Desktop so to be able to mimic it is important. Jonathan showed you how to complete the Modified Competition rank in the Solution post to week 3 . Let's look at the differences where the values are 10, 9, 9, 8.  Standard Competition: 1, 2, 2, 4 Modified Competition: 1, 3, 3, 4 For me, Standard Competition makes a lot more sense as the user (maybe I've been using Tableau for too long) so I really wanted to achieve this in Prep. The challenge This week's challenge leads up to one of my favourite sporting tournaments of the year - the Six Nations. For those who don't know, this tournament is where England, France, Wales,

How to...Connect to a Database

Image
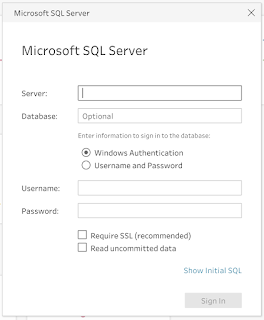
Using data files will be a significant part of most users data preparation but connecting to databases should not be ignored. Most organisations have built up significant data assets and the majority of this data will be held within databases. What is a database? Databases, data warehouses and data lakes will all be common terms to most people working close to those using data in their jobs everyday but not everyone will be familiar about the differences.  Database - a piece of software that resides on a computer (often a server) that specialises in ingesting, storing and providing data to other tools. The database is likely to be split up in to different objects namely tables and views, therefore, the data needs to be well structured. Data Warehouse - a collection of databases, or particularly large databases, are commonly called a data warehouse. By storing multiple databases together, it becomes beneficial as resources like memory can be shared between the servers.  Data La

How to... Choose an Output

Image
Tableau Prep is built primarily for preparing data for visual analysis in Tableau Desktop. This inevitably means Tableau has designed the tool to be very easy to output the data when it is ready to Desktop. The level of simplicity might mean that you miss the optimal output type for the purpose you are using Prep for though.  What output types are there? Within Prep there are four main output types to consider. Each has their own main reason why you would use them so let's explore each in turn: File Types - Hyper Tableau's new form of extract made lots of data work faster; in some cases, a lot faster! Hyper files came in to Tableau Desktop and Server in version 10.5. Opening any data extract in Tableau automatically updated the extract to a Hyper format.  If you use the Tableau tools in an version newer than 10.5 (the last version before the naming changed to 'Year.Version' (ie 2018.1) then outputting to a Hyper file is a safe bet that the data is i

How to...Handle Free Text

Image
Free isn't always a good thing. In data, Free text is the example to state when proving that statements correct. However, lots of benefit can be gained from understanding data that has been entered in Free Text fields. What do we mean by Free Text? Free Text is the string based data that comes from allowing people to type answers in to systems and forms. The resulting data is normally stored within one column, with one answer per cell. As Free Text means the answer could be anything, this is what you get - absolutely anything. From expletives to slang, the words you will find in the data may be a challenge to interpret but the text is the closest way to collect the voice of your customer / employee. The Free Text field is likely to contain long, rambling sentences that can simply be analysed. If you count these fields, you are likely to have one of each entry each. Therefore, simply counting the entries will not provide anything meaningful to your analysis. The value is in

How to...Filter

Image
One of the most important factors when cleaning data is deciding whether the data: Can be cleaned up? Should be ignored? Has to be removed? As soon as you decide on the latter option, then you need to filter out of your dataset. This sounds like a very easy decision to make but shouldn't be that easy, especially if you are preparing data for others to use. Being certain that you, and the data sets user, doesn't need this data going forward is a difficult challenge. Unless you are certain it isn't needed, don't remove the data unless it is the last step in the process before publishing for the following reasons: Losing context - does that data help the user provide context to other data points? Messy but manageable - Just because the data might be hard to tidy up, could it still be of value Business logic - by your user having different business experience, does the data suddenly have meaning? So let's get back to basics first to explore what is a filt