Posts

Showing posts with the label filter

2022: Week 26 - Making Spotify Data Spotless

Image
Challenge By: Algirdas Grajauskas It's always great when a Data Schooler in training comes up with an idea for a Preppin' Data Challenge! Al is part of DS31 and has been in training for 3 months now. For this challenge we're going to clean up and analyse his Spotify data.  Input Unclean Spotify data – from Spotify  Requirements Input the data Create a new field which would break down milliseconds into seconds and minutes e.g. 208,168 turned into minutes would be 3.47min Extract the year from the timestamp field Rank the artists by total minutes played overall For each year, find the ranking of the artists by total minutes played Reshape the data so we can compare how artist position changes year to year Filter to the overall top 100 artists Output the data Output 10 fields Overall Rank Artist Name 2015 2016 2017 2018 2019 2020 2021 2022 100 rows (101 including headers) You can download the  full output here .  After you finish the challenge make sure to fill in ...
2022: Week 25 - Housing Happy Hotel Guests

Image
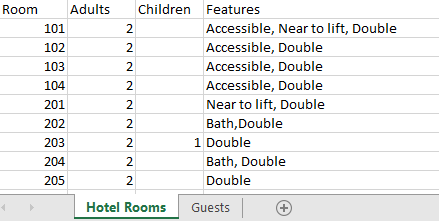
Challenge by: Jenny Martin Imagine you're working at a hotel and the process of assigning guests to hotel rooms is very manual and often based off the expertise of those that have worked in the hotel for a long time. You've managed to pick the experts' brains to get a comprehensive list of the features of each hotel room and you want to build a simple proof of concept workflow that would allow users to immediately see which rooms would be suitable for each guest. We're not worrying about assigning guests to rooms just yet, this is just the first step to proving how an automated workflow could help to make life easier! For a room to be suitable for a guest it must: Have enough capacity for all adults and children in the party (no one's allowed to sleep on the floor!) Have either double or twin beds as per the guest's preference Be accessible if the guest has accessibility requirements Satisfy as many of the additional requirements as possible Inputs Hotel Rooms  ...

2021: Week 5 - Solution

Image
Solutions by Jenny Martin & Jonathan Allenby and you can download the  full workflows here .  This week we were looking at de-duplicating and updating our training attendee data. In this challenge we mentioned that you can use Prep to avoid having to use LODs in Tableau Desktop, especially as Prep is so great at de-duplication using Aggregate steps. However, if you're comfortable with LODs then you can use them within Prep where it is more manageable to track and modify your changes. In the first solution, Jenny demonstrates how to avoid these LODs completely and in the second Jonathan shows how you can use LODs to achieve the same outcome. Both solutions are valid and which one you gravitate towards will likely just be a matter of personal preference and instinct. Solution A : No LODs Step 1 - Getting the current Account Managers and IDs In order to avoid LODs and table calculations we're going to make use of the Aggregate and Join steps in order to summarize and update o...

2021: Week 5 - Dealing with Duplication

Image
Challenge by: Jenny Martin Have you ever been working with a dataset in Tableau Desktop and noticed some duplication occurring? Of course, this is something you can fix with some potentially tricky LODs or Table Calc filters, but wouldn't it be nicer for your dataset to be viz ready before heading into Desktop?  If you attended the Tableau Fringe Festival last year, this concept may feel familiar, as I did a quick demo explaining why I, personally, would prefer to use Prep to solve my duplication issues. You can find the video here  if you like. Input The dataset we'll be working with for this challenge follows the same theme as the Fringe Festival. We have information relating to which of our Clients are attending our training sessions. Also included in our dataset is which Account Managers look after which Clients. However, we have historical information about Account Ownership which is leading to duplication. So how can we fix it? Requirements If you're new to the techni...

2019: Week 33

Image
Chin & Beard Suds Co management team have heard there is unrest in a few of their Northern stores and asked their HR data manager to pull together some supporting files. Sadly for us, those files are going to take some data prep to ensure we can conduct the analysis we want to.  Leeds Store Staff   Sheffield Store Staff Salary Ranges Store Sales The rumours we've heard are: We are paying people more than our Corporate Pay Ranges that we have agreed Bonuses account for very little (less than 10%) of someone's salary We want your help to answer these questions for us. There are some contractual pay conditions you should consider: Bonus will be paid as long as you are still an employee for at least the 1st day of the final month of the quarter. Consider only employees who received salary during 2019 Anyone paid above the salary range will receive no bonus (we pay them enough already) Assume today's date for the analysis is 1st October 20...

2019: Week 31 Solution

Image
You can view our full solution workflow below and download it here ! Out full solution workflow. 1. General preparation: pivoting statuses. The first stage towards all four outputs is to get all the [Date]s for a single [Order] onto the same row, giving each [Date] the appropriate [Status] field name. To achieve this, simply use a Row-to-Columns pivot. Put [Status] onto ‘Pivoted Fields’, and put the MIN or MAX of [Date] onto the aggregation section We can take MIN or MAX as there is only one [Date] per [Status] per [Order], so MIN & MAX are one and the same. Pivoting the statuses. 2. Get preparation: getting the time between dates. The second stage of general preparation is to calculate the [Time to Send] and the [Time to Review from Sending Order]. To calculate these we can use the DATEDIFF() function to get the days between [Purchased], [Sent], and [Reviewed] [Time to Send] [Time to Review from Sending Order] DATEDIFF('da...

2019: Week 30

Image
Data is everywhere and when your colleague finds a fun dataset then it instantly needs to be cleaned. This is what happened when Andy Kriebel found the Serpentine Swimming Club tweets that record the temperature and a fun comment about what happened that day. So what words get used more as the temperatures increase? How about those 'nippy' 10oC days? Well I've produced a simple Tableau Public view to let you analyse the output and check your results. Requirements Serpentine Swim Club tweets Common Words file (same as PD week 6) Input the Serpentine Tweets Only keep tweets that give water / air temperatues Extract Water and Air Temperatures as separate columns Remove Common English words by linking the 2nd Input (Common English words) Remove unrequired fields and remove punctuation from your words from the tweets Output csv or file type of your choice if you want to build the view Output 7 Columns (Comment Split, Category, TempF, ...

2019: Week 29

Image
At Chin & Beard Suds Co we are developing a growing base of customers ordering on a regular basis, as a result we have decided to release a subscription option. Customers are now able to choose a package of soap(s) they wish to be sent from our range and the frequency they would like to receive their basket of soapiness. We have a total of 7 different types of products available to choose from and customers can select any number of, or variation. A current list of subscriptions made can be found in our customers table. Reference tables for product aliases and frequency aliases are available in our subscription products table and subscription packages table. One option is our mystery package…this could be any of the other 6 package types. To make our customers happy, we have decided to mimic our current customers’ choice of package type. Therefore, if more people like the Active, it should be more likely that we would send this out as the Mystery subscription type. So how much sh...

2019: Week 26 Solution

Image
You can view our full solution workflow below,  download it here , or view the walkthrough video further down! Our full workflow solution. This week we’re using straight out-the-box Tableau Prep and taking away the power of writing calculations in order to highlight some of the great features that are built into it. Some of the things used within this challenge are: Splitting a field up into multiple fields. Pivoting columns to rows. Filtering data. Cleaning up data (optional). Aggregating data. Joining data together. And all this without having to do any typing other than renaming some fields for clarity! This will be quite a simplistic write-up, but that’s just a reflection of how simple all these tasks are once you know how to do them. Splitting up the ingredients. Click on the [Ingredients] field and click ‘ Custom Split… ’ (either from the profile pane toolbar or by clicking the ‘ More Options ’ dots on the field itself & clicking ‘ Split Values ’...

2019: Week 18

Image
Due to the comparable commercial successes of both Chin & Beard Suds Co and Your Name (Kimi No Na Wa) we've decided to pull together funding in order to produce a Chin & Beard Suds Co anime to raise our profile even further and hitting that otaku market. We're aiming to release a short series: Endless Legend of the Soap Heroes ( Kono Sekken Wa Hidoi), and a follow up movie: Endless Legend of the Soap Heroes: The Legend's End (Kono Sekken Wa Hidoi:   Atsui Gomi No Kaori ) by the end of 2022. However we haven't been able to decide on what genres to theme our anime around. We'd like you to help us make this decision by using a bunch of data scrapped from MyAnimeList.net to figure out the most popular genres. We also want to find prime examples of these genres to rip-off copy trace-over   just straight up put our own watermark on  use for inspiration. A snippet of the input. Requirements Input the data . Consider only TV shows and Movies - ...

2019: Week 15 Solution

Image
You can view our solution workflow below and download it here . Full solution workflow. There are 3 main learning objectives for this week's Preppin' Data challenge: Using "Wildcard Unions" & file paths. Using aggregations to calculate "percent of total" fields. Creating Filter calculations. Unioning the data and getting the regions We’ve got five CSVs, one for each region, and all of them have the same data structure – sounds like a call for a Wildcard Union input! Instead of inputting each file separately we can: Applying a Wildcard Union Add one of regional stock files to the canvas. Switch to the Multiple Files tab. Select Wildcard Union . If they share a folder with other files, define a “ Matching Pattern ” of “* Stock Purchases.csv”.  This means only  files that end in “Stock Purchases.csv” will be imported into the union. Click Apply . From here, Tableau Prep automatically unions all the data together for yo...