Posts

Showing posts from June, 2019

2019: Week 20

Image
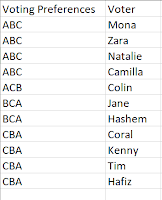
This week, Chin & Beard Suds Co. have had a local hospital get in contact about a number of patients who have had an allergic reaction to some of our products. As a company who love our customers, we want to cover their medical expenses as we haven't labelled our products clearly enough (or people aren't reading the ingredients). We have managed to get hold of a list of patients:  But we need to look at the total cost of their hospital stays. A daily cost has been quoted to us, but this differs on the length of stay as there are some admin costs for any new patient:  Requirements Use the various input sheets in the Excel file to build a view of individual cost per day per patient. Use the scaffold provided to build out a complete data set that includes all days one of our customers is in the hospital To determine cost, you pay £100 for each of the first three days, then £80 for the next four days and then £75 for each of the following days. Aggregate

2019: Week 19 Solution

Image
You can find our full solution workflow below and download it here ! The full solution workflow. There are two main ways to convert the [Time] and [Gap] fields into seconds and I’ve decided to highlight both for this solution post, as well as putting both in the solution workflow (as seen above). Use String functions within a single calculated field This is my preferred method, but it requires you to know how far into each field the desired numbers lie. To make this easier for myself I first used the Clean options to filter out all Letters, Punctuation, and Spaces. Use the LEFT() function to obtain the hours, the MID() function to obtain the minutes, and the RIGHT() function to obtain the seconds.  Use the  INT() function to convert these into integers. Multiply the hours by 3600 (60*60) and the minutes by 60. Add them all up and use ZN() to convert any NULLs to zeros. You can see the full formulas below. [Time (secs)] [Gap (secs)]

How to use... Data Roles

Image
In Week 2 of Preppin' Data we set a challenge about grouping City Names together. Let's face it, 'Group and Replace' in Tableau Prep is pretty incredible with the rich, easy-to-use options that are built in to the tool. If you haven't had a chance to explore these then I recommend attempting Preppin' Data Week 2 as you get to use these techniques on the 'City' field. Do this before continuing to read this article as it will save a few 'Spoilers'! _________________________________________________________________________________ Well the Tableau Devs have gone one step further than we even hoped and have added an extra level of validation to our data cleaning: Data Roles. For String data fields, you now have the ability to set a specific Data Role for Prep to test the data against. Geographic Role, Email Address and URLs can be tested to see if they are valid against Tableau's own list. How to use Data Roles: Where you click on

How to use... Custom SQL in Prep Builder

Image
One of our intentions with Preppin' Data is to help people understand more about the tool. From questions we receive, we want to use the site to help people get the most out of the tool - not just learn through challenges. A colleague asked today about how to create a Custom SQL query in Prep Builder. She couldn't find any resources online so hope this helps! 1. Connect to your Server by choosing the type of database it is 2. Enter the server connection details 3. Pick which database you want to connect to 4. Select Custom SQL from the bottom of your list of tables (you may need to scroll through) by draging this on to your flow pane. 5. Enter your Custom SQL in the grey area when you have the 'Custom SQL' input selected in your flow pane (not pushing my SQL skills here!) You will then have access to the date you have formed by your Custom SQL query and can use it as a normal data source ie join it, union it or clean it as you would with

2019: Week 19

Image
Chin & Beard Suds Co. is growing from strength to strength and this has led us to think big - sponsorship! As a keen road cyclist, I use a lot of soap to stay clean from wet, muddy and sweaty rides so the sport choice was obvious. The event to sponsor was even more so... the Tour de France! It starts in a couple of months so the only remaining question is which team?  What we are looking for in the team to sponsor is a team that works really hard (ie are sweaty!) but are all consistently doing well as we don't want riders sponsoring our soap at the back of the pack or worst "slipping" off the back of the peloton.  Requirements Using the results from letour.fr of last year's race we want you to find the team for us to sponsor. The team must: Use the 2018 Tour de France results as your input Make all time fields seconds before doing any of the calculations (we like precision at C&B Suds Co.) Have seven or more riders complete the tour Mus

2019: Week 18 Solution

Image
You can find our full solution workflow below and download it here ! Our full solution workflow. Learning Objectives: • Explore some other filtering methods. • Practice using splits and pivots. • Learn how do to multiple aggregation types on the same field. Filtering out shows with less than 10000 viewers Here is a filtering method you may now have come across yet: On the [Members] field, click the 3 dots, then click Filter, and then select Range of Values. This gives us 3 options: - Range - Minimum - Maximum This allows us to use a slider or text boxes to define the filter condition opposed to having to manually write a filter calculation. In the case of this challenge, selecting Minimum and entering in 10000 will filter out the low viewership shows as required. Splitting & Pivoting the genres so they can be aggregated In order to calculate the viewerships and rating for each genre we need to transition from having multiple genres in a single row to

2019: Week 18

Image
Due to the comparable commercial successes of both Chin & Beard Suds Co and Your Name (Kimi No Na Wa) we've decided to pull together funding in order to produce a Chin & Beard Suds Co anime to raise our profile even further and hitting that otaku market. We're aiming to release a short series: Endless Legend of the Soap Heroes ( Kono Sekken Wa Hidoi), and a follow up movie: Endless Legend of the Soap Heroes: The Legend's End (Kono Sekken Wa Hidoi:   Atsui Gomi No Kaori ) by the end of 2022. However we haven't been able to decide on what genres to theme our anime around. We'd like you to help us make this decision by using a bunch of data scrapped from MyAnimeList.net to figure out the most popular genres. We also want to find prime examples of these genres to rip-off copy trace-over   just straight up put our own watermark on  use for inspiration. A snippet of the input. Requirements Input the data . Consider only TV shows and Movies -

2019: Week 17 Solution

Image
You can find our full solution workflow below and download it here . The full solution workflow. This week there weren’t any specific learning objectives – more just a good chance to apply Tableau Prep to real use cases, such as the issues with choosing a fair voting system. As such there are a ton of different ways of arriving at the final output, none of which are wrong. Apart from perhaps filtering down to 3 lines of data and manually replacing the values with the desired values. That’s kind of wrong and shame on you if you did that. Regardless, below we’ll still present some of the techniques we used to complete the challenge. Bordia Splitting the votes into separate fields In order to create a [1st Choice] , [2nd Choice] , & [3rd Choice] field we made use of the LEFT() , MID() , and RIGHT() functions to pull out the first character, 2nd character, and last character of the [Voting Preferences] field respectively. [1 st Choice] [2 nd C

2019: Week 17

Image
This week’s challenge comes courtesy of Jenny Martin from DS14 of The Data School and her experience in writing a dissertation on how to rig elections different voting systems: We’ve had a lot of votes in recent years and I’m sure everyone’s just about had enough by now. Naively, I used to believe that the process you use to determine the “winner” of a vote was irrelevant, surely they’re all roughly the same? Then I got to university and discovered this depressing theorem: Arrows Impossibility Theorem For elections with 3 or more candidates, there is no voting system that satisfies the following conditions: ·         Not a dictatorship ·         If everyone ranks A above B, the population should rank A above B ·         If C withdraws from the election, the ranking of A and B should not change.  I thought it would be fun to prove this disconcerting truth in Tableau Prep with some common voting systems! There are 3 I would like you all to

2019: Week 16 Solution

Image
You can find our full solution workflow below and download it here ! The full solution workflow. Learning Objectives: Practice wildcard unions to manage & speed up inputs. Practice using filter calculations for more precise and versatile filtering. How to workaround the lack of table-calcs in Prep to: Add ranks to your data. Create a top N% filter. Unioning all the relevant data In last week’s solution post we mentioned how using the Wildcard Union could be used to not only quickly import and combine your data but also ensure you only import the data you actually want to import. The Wildcard Union. Add one of sales files to the canvas. Switch to the Multiple Files tab. Select Wildcard Union . Define a “ Matching Pattern ” of “Sales_*”.   This means only files that start with “Sales_” will be including in the Wildcard Union. Click Apply . Obtaining data from just the last 6 months Here we’re also reinforcing lessons from last week by introducing