Posts

Showing posts from February, 2019

2019: Week 3

Image
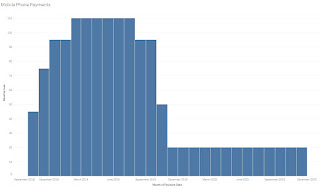
This week we are going to step up the challenge a little. If you are going to blame anyone then it's only yourselves for doing such a great job so far on solving our challenges! This week's inspiration comes from Bethany Lyons, a Tableau Product Manager . Bethany's sessions at the conference are phenomenal each year and always tackle some pretty chunky issues. Her session at the Tableau Conference in 2017 was on how to handle data on subscriptions. If you've never come across this challenge (lucky you) then you are about to experience why this is an issue. Scenario: You work for a mobile / cell phone company. You boss asks you to pull together the revenue report of your current batch of contracts (sadly there are only four contracts!). They need to know how much revenue is generated each month from these contracts whilst they are 'live' (ie from their start date until 'x' months in the future when the contract runs out). The aim of the week i

2019: Week 2 Solution

Image
No hints this week in the background image I’m afraid! We also need to lead with a quick apology to those of you caught out by the fact we didn’t initially specify that one of the requirements was a bit of a nightmare if you hadn’t updated Tableau Prep to at least version 2019.1.  Once again, we saw a range of varying solutions to this challenge – all legitimate and correct – but there were 3 main features we were hoping to give some exposure in order to assist you in the future! You can find our solution here (seen below) which uses these features and can read on for further details about each one. Our Clean steps could all be done in the Union step, however spreading them out makes the flow more manageable in the future. The Data Interpreter The data interpreter is so easily overlooked yet is so useful. It can detect things like titles, notes, footers, empty cells, and so on and bypass them to identify the actual fields and values in your data set.  In

Getting Started with Tableau Prep Builder

Image
The whole reason why Jonathan and I created Preppin’ Data was to give people more experience with Tableau Prep Builder and Data Preparation more generally. But what if you have no experience at all? How do you start? Read on to find a simple roadmap to get started with Tableau Prep Builder. So what is Tableau Prep Builder? Available for Windows and Mac Operating Systems, Tableau Prep Builder is designed to allow you clean, join and transform data so it is easier to analyse (probably in Tableau). Like any data preparation, you will transform the data in a step-by-step approach. Often data preparation feels like a logic puzzle and we have designed Preppin’ Data to recreate that approach.  Have you got step-by-step instructions to follow?  Sure:  1. Read Tableau’s description of Prep Builder Go to: https://www.tableau.com/products/prep   to get an overview of what Tableau Prep Builder is designed to enable you to do. 2. Download the latest version of Prep Builder This

2019: Week 2

Image
So you survived week one (note: if you haven’t completed week one - go back and give it a go as we will be layering the techniques over time)... well done and let’s kick this up a notch.  This week’s challenge uses a few of Jonathan’s and my favourite Tableau Prep features. Prep has a load of great features built in to the menus so let’s see which of them you can use to save you lots of fiddly calculations.  So what’s the data? We need you decide where you are going to in the UK; London or Edinburgh, purely based on the weather (every Brit’s favourite subject). *edit* - you need to update to at least version 2019.1 or there are some serious work-arounds to be done! Requirements for this week: Import the file Get rid of those nicely formatted titles - no-one is viewing this in Excel! (sorry Excel fans) Make sure you get all the data in the Excel sheet loaded in to Prep Clean up the City names to create two cities in one column (London and Edinburgh) Pi

2019: Week 1 Solution

Image
First things first, a big thanks to all who have taken part. The response has been great and it’s good to know that this is a worthwhile initiative. It’d be interesting to know how many of you cottoned on to the fact that Carl’s initial solution to week 1’s challenge is actually publicly visible as the background header image on this blog! There were a few different ways to tackle each part of this challenge – we’ll cover a few of the possibilities for them and share two possible workflows. To recap, the main challenges presented were: Make a date that will work in Tableau Desktop Work out the total car sales per month / per car dealership Retain the car sales per colour columns Solutions are available as packaged workflows here or linked in the article below. Make a date that will work in Tableau Desktop One of the easiest ways to create the date using the given information is using of the following two functions: MAKEDATE (year, month, day)

2019: Week 1

Image
Welcome to your first Preppin' Data challenge. This week, Jonathan and I would like you to look at taking a simple Excel file on Car Sales and complete the following requirements: Import the starter file  (click to open the Google Drive link) Make a date that will work in Tableau Desktop Work out the total car sales per month / per car dealership Retain the car sales per colour columns Export the file  Due to the way Tableau Prep works, your output: Might not have the same row or column order as our output Will have the same number of columns (7) Will have the same number of rows (48) For comparison, here's our output file . For bonus points - you can build a visual analysis of this mocked up data set. 

What's Preppin' Data about?

Welcome to Preppin' Data. This is a site run by Carl Allchin  ( @datajedininja ) and Jonathan Allenby ( @jonathanallenby ) to give Tableau Prep users regular examples to test their Data Prep skills. Tableau Prep is a rapidly developing tool. At the time of writing, the Prep development team is releasing monthly updates to the Prep tool. This means that users are rapidly being challenged to learn and maintain new techniques. When Jonathan asked me what ways are there to practice his Prep skills, we didn't find much and therefore, we will learn as you do. So what will Preppin' Data involve: A weekly challenge to manipulate a data set that we provide in to an output that we will publish too.  On the following week, we will add the solution file to previous week's folder and set a new challenge. There is never a single right way to conduct your data preparation (there are wrong ways where you get the wrong output) so we want to hear from you. Tweet or blog abou