Posts

Showing posts with the label String Calculations

2022: Week 44 - Creating Order IDs
Image
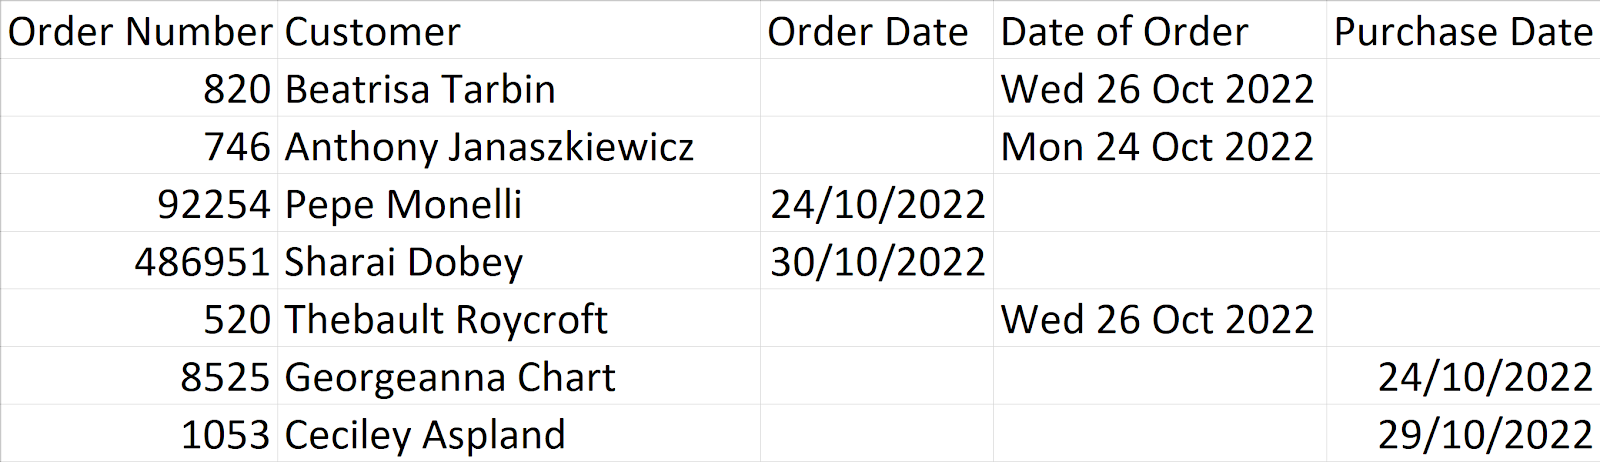
 Challenge by: Jenny Martin When I started out in the data world, I had some naïve assumptions. For instance, I thought all datasets would come with a unique identifier. Unfortunately, I've since worked with many datasets where this has not been the case! Whilst it will depend on the data structure as to how you choose to work around this, for this challenge we'll we using a combination of 2 fields to create a unique identifier.  The idea for this challenge came from a member of DS35 Stephen , in his second week of training. He found a creative way to recreate the padleft function from Alteryx in Tableau Prep! Keep your eyes peeled for a full challenge created by Stephen in the near future! Input Our input this week contains duplicate Order Numbers. However, they belong to different Customers, so let's use a combination of these fields to create an Order ID.    Requirements Input the data Aside from our Order Number issue, you'll notice we have 3 fields for Order Dat...

2022: Week 12 - Gender Pay Gap

Image
 Challenge by: Jenny Martin I spent my International Women's Day being really fascinated by the Gender Pay Gap Bot on Twitter. I decided to look at the publicly available data that it was based on and found it a little confusing. It made me realise that the thing I enjoyed most about the Pay Gap Bot, was that it made it the insight from the data clear in a succinct manner. So let's do that for the historical data too!  Inputs We're using the data currently available on the Gender Pay Gap Service from 2017 to 2022:  There are 5 input files. Requirements Input the data Combine the files Keep only relevant fields Extract the Report years from the file paths Create a Year field based on the the first year in the Report name Some companies have changed names over the years. For each EmployerId, find the most recent report they submitted and apply this EmployerName across all reports they've submitted Create a Pay Gap field to explain the pay gap in plain English You may en...

2021: Week 29 - PD x WOW - Tokyo 2020 Calendar

Image
Challenge by Tom Prowse with collaboration with the Workout Wednesday team! This week is time for our annual get together with Workout Wednesday for a joint challenge so that you can have a full data prep to visualisation solution.  Unfortunately the Olympics was postponed in 2020, so for last year's collaboration we looked at historical winners through the history of the games. However, this year, Japan 2020 is going ahead so we thought it would be the perfect time to create an event calendar to help us keep track of the events that we don't want to miss.  Inputs The data comes from the Olympics website . ( Note; this was taken on Wednesday 14th July so the schedule for some events may have changed since! ). You can download the data here .  1. Event Schedule A list of all the event dates, times and locations throughout the games 2. Venue Details A list of all of the different venue locations Requirements Input the Data   Create a correctly formatted DateTime fiel...

2021: Week 9 - Working with Strings

Image
Challenge By: Owen Barnes We have a guest contributor this week! Owen has just finished up his training at the Data School and is a regular Preppin' Data participator. So here's his challenge: This challenge will be useful for anyone trying to improve their knowledge of Tableau Prep functions, and their data parsing in general. There is an opportunity to use ReGex in this challenge, but there is a longer workaround with other steps available. There will also be the chance to use LODs in this workflow. We have been given a set of messy strings, which contain useful information that we need to connect to other datasets to eventually find out how much revenue we have generated by selling different products. This string provides us with information such as the quantity of items sold, the product ID code, the phone number of the buyer, and the area code which will let us find out where they are purchasing from. There will also be some small calculations needed to join certain datas...

2020: Week 20

Image
There are a couple of techniques that I use when Preppin' my Data that aren't quite native in Tableau Prep yet. So I'm curious to set a challenge which requires them and see the different work arounds that people come up with! Splitting up a string into individual characters, sometimes referred to as tokenising. Currently you need to have a specific delimiter when splitting a field - what if I wanted to specify the length of each chunk that I want the string to be split into?   Concatenating strings when aggregating. Currently you can only count the values or return the min or the max, but sometimes I'd rather concatenate the multiple values! To play with these techniques, we're looking at ciphers for this week's challenge. You've received an encrypted message and need to decode it using the provided cipher!  Inputs There are 3 inputs this week. You may not need to use all of them, depending on how you approach the challenge. Require...

2020: Week 19

Image
This week’s challenge is a follow-up from last week ( Week 18 ) as we want to do some further analysis! Last week we found out how many minutes each player had played. Now we want to do some analysis about what positions they were playing in, and how many goals were scored. We are again going to use the lineup data source from last week, then also add some new data sources: 1. Player List. A list of all players at Liverpool, and their preferred position group. The numbers at the start of the string is their squad number, and not the position number from the lineup table. 2. Position List.  This provides us with data about the formations that Liverpool have used, and how these player numbers mapped to positions and position types. Requirements Input the following:  Your Week 18 Workflow Player List  Position List All of these can be downloaded here . We require two outputs this week; they have been broken down here: Output 1 Calculate...

2019: Week 39

Image
The Head Honchos of Chin & Beard Suds Co want to understand how their website is performing. Are the web pages being tested on the right devices and Operating Systems? Are we considering language and cultural references? To conduct this analysis, our website stats are held in a frustrating way but this analysis won't be done just once so we want to set up the flows so they are available in a reusable way to conduct this analysis whenever needed.  Requirements Input the Excel workbook Create a single table for each of Origin, Operating System and Browser Clean up values and percentages Convert any < 1% values to 0.5 If percent of total fields don't exist in any files, create these and make them an integer Create a consistent output for all three files Outputs 3 Files with the following 6 columns: Type (either Origin, Browser or Operating System) Change in % page views This Month Pageviews Value This Month Pageviews % All Time Views Valu...

2019: Week 25 When PD met Workout Wednesday

Image
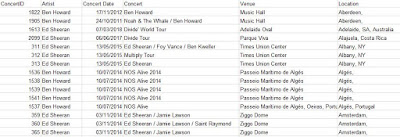
When Lorna suggested we set-up a challenge for Tableau users to not only complete a Workout Wedesday live but use Tableau Prep Builder to prepare their data then we jumped at the chance to collaborate. This week is held as a live session (I'm waving if you are in the room and if you're not here, you're welcome to take part too) so we have built a combined challenge that should only take a few hours in total even if you new to either tool. So what's the challenge? To celebrate Tableau's Music month Lorna found a great data source on one of her favourite artists (Ed Sheeran) that led me to ask a question about one of my faves (Ben Howard). We want to analyse the two artists careers based on their touring patterns and as two UK-based singer-songwriters who appeared on the UK music scene at similar times, how have they developed. The Preppin' Data part We have taken the gig history from concertarchives.org  and done a little pre-cleaning as we wanted the ch...

2019: Week 24

Image
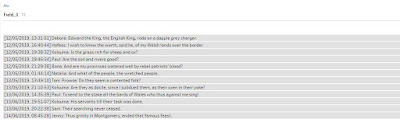
Previously on Preppin' Data... (I'm still a 24 fan) a lot of Data Schoolers  have been working through the challenges and this week they wanted to post their own so a big thank you goes out from Jonathan and I to Kamilla and Bona of our fourteenth cohort at the Data School for this challenge. They don't know whether it's too hard or not so please let them know! Both of the challengers this week love to use regex so wanted to give those who haven't had the chance to use the language before the chance to explore it. If you want to stick with the string calculations you can but it might be a little tougher! If you haven't used regex before then the team recommend you use  https://regexr.com/  to help you get to grips with what is going on. With all of that in mind, what is the challenge? Analysing messages from the Data School What's App group. Don't worry we are not sharing any insights in to what the Data Schoolers think of their coaches (phew!) a...

2019: Week 23 Solution

Image
You can view our full solution workflow below and download it here ! Our full workflow solution. Wildcard Union. Importing the data The very first requirement is to import all the sheets from the input data. The quickest way to do this is to simply drag one of the sheets from the connections pane onto the canvas and select the 'Wildcard Union' option. By default this option will include all sheets within an Excel file and union them together! We want to remove the [File Paths] field but leave the [Table Names] field as it contains date information that we'll need later when calculating the actual dates for each row of data. Calculating the dates There's two stages to calculating the exact dates here: Stripping the 'week commencing' date from the [Table Names] field. Converting the [Day] field to something that we can add to the 'week commencing' date. Stripping the WC date Getting the [Week Commencing] date. There's a vas...

2019: Week 23

Image
We need to talk about Dave... he's a good salesman but he's not our analysts' best friend. Dave is "too busy" to consistently enter his data. He likes to sometimes hit CAPS LOCK. Does Dave even know the shift key exists? Our challenge this week is to tidy up the messy data Dave has left behind him by creating a nice data set so we can analyse his sales, favourite customers etc. Requirements Input Data Bring in all tabs of the Excel Sheet Create the date of the sale Create a column for the scent of the product Create a column for the product Create a column for the customer name - with the customer's name in Title Case  Output One file 6 columns of data 18 rows of data (19 rows including headers) No nulls For comparison,  here's our output files .  Don't to forget to fill in our  participation tracker !

2019: Week 11

Image
This week is all about stocks but you have Ian Baldwin to thank for this challenge. He posed us the challenge of taking a JSON output from a shares website and turning it in to a file for use within Tableau. Tableau Prep does not have a connector to allow us to download the data from the site (yet??), or parse JSON (yet??), but we can take a very raw file and manipulate the data file to build out a table that we would commonly use in Tableau Desktop. Requirements Input data from the .csv Break up the JSON_Name field Exclude 'meta' and '' records in the same column to just leave 'indicators' and 'timestamp' For the column containing our metrics, if this is blank, take the value from the 'indicators' / 'timestamp' column. Rename this field as 'Data Type' There is a column that will contain just numbers (up to 502). If this column is blank then take the value from the other column that contains similar values up to 50...

2019: Week 10

Image
Following our complaints analysis last week, Chin & Beard Suds Co. (still our mythical organisation) is looking to manage its marketing mailing lists. Sadly, our customers are not just sporadically complaining, they are also choosing not to receive of marketing. We are continually releasing new scents in our products and we want to let our customers know. Sadly for us, our website has an unsubscribe button that only let's people enter their First and Last Name. It does capture the date they want to unsubscribe so they can resubscribe at a later date. Our mailing list is a list of emails that are consistent enough that we can join these two data sets together, but not easily. The business needs to understand not just who they can market too but also, how much revenue we are losing by our customers not showing interest in us. Luckily, we have the raw data to help us understand this but: We want to have a nice list of emails that we CAN still market to (and include if they ...

2019: Week 9

Image
The rollercoaster ride of Chin & Beard Suds Co continues unabated. This time we have been asked by our Social Media manager to run our analytical minds over some questions on Complaints we receive via Twitter. Our Social Media manager has just pulled out the complaints for us to analyse where someone has tagged our Twitter handle @C&BSudsCo but then followed up with some issues raised. We need to know the common themes of these tweets and be ready to re-run this analysis at any time. In order to do that, we want you to make the data available to build a view on what common words are used in the complaint tweets. Requirements: Input data Remove Chin & Beard Suds Co Twitter handle Split the tweets up in to individual words Pivot the words so we get just one column of each word used in the tweets Remove the 250 most common words in the English language (sourced from here for you:  http://www.anglik.net/english250.htm ) Output a list of words used alongside ...

2019: Week 8

Image
As we saw last week, Profits are rolling in nicely from Chin & Beard Suds Co. but all is not perfect at the company. Recently our Suds shops have been the victim of a number of thefts. Thankfully our systems allow our stores to record the thefts, when the theft occurred and when we adjusted the inventory to reflect the reduced amounts. The data has all the parts we need to answer a few questions: What product is stolen the most? How many items of stock haven't been updated in the inventory levels yet?  What stores need to update their inventory levels? Which store is the fastest at updating inventory levels post a theft? Which stores have updated their stock levels incorrectly? To be able to answer these questions, we need you to create the following data set. Requirements: Input data from both sheets Update Store IDs to use the Store Names Clean up the Product Type to just return two products types: Bar and Liquid Measure the difference in days bet...

2019: Week 5

Image
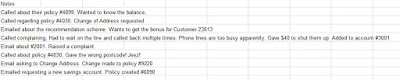
Hands-up all of you who have a system in your organisation that let's your team enter free text answers in to a system? Ok, well that's most of you and I feel for each and every data guru that sits at the end of the database where that information is stored. If you didn't put your hand up, you will have a lot to learn this week! I have often wondered whether I would have a career if it wasn't for projects delivering new operational systems not considering that the 'Junk In' to 'Junk Out' rule is a very pertinent one. Project budget cuts, lack of data awareness and time constraints all lead to a perfect storm of project delivery challenges. One of the side-effects of this is felt as soon as the project releases; how is the new system performing and is it doing what we expected? Welcome to this week's challenge! The input for this week's data is from a small financial services company's contact centre who have to measure some key statisti...