2020: Week 14
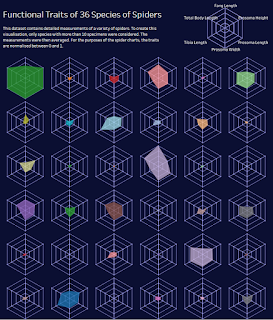
Welcome to Preppin' Data 2020 Week 14. Fun fact: DS14 started at the Data School a year ago today! It seemed only fitting that a member of DS14 should therefore come up with this week's challenge. So, this week we're thinking about how to get your data in the right structure to build spider charts (aka radar charts) in Tableau Desktop. What better data to use than the measurements of actual spiders? The data comes from figshare.com and contains information about 2,841 different spiders - preferable to going out and collecting the data for ourselves. Ultimately, the goal would be to be able to create something like this (but no obligation to do so!): Link to the viz Requirements Input data . Filter out any specimen that doesn't have a measurement for each trait or those with '*'s against measurements. Clean up fields containing '_'s. We only want to consider species for whom the measurements of at least 10 different specimens were record...
