Posts

Showing posts with the label week17

2022: Week 17 - The Price of Streaming

Image
Challenge by: Jenny Martin This challenge was inspired by a recent use case from a client. It involves bringing together 2 datasets which have different levels of aggregation. They were initially trying to do this in Tableau Desktop but getting a bit muddled with the calculations going on "in the background." So let's use the power of Prep to map out the process and make everything much clearer.  Inputs Streaming sessions from users  Avg Pricing for each month  Requirements Input the data Check the location field for spelling errors Data roles may help you identify these Fix the date fields so they are recognised as date data types Aggregate the data to find the total duration of each streaming session (as identified by the timestamp) We need to update the content_type field: For London, Cardiff and Edinburgh, the content_type is defined as "Primary" For other locations, maintain the "Preserved" content_type and update all others to have a "Second...

2020: Week 17

Image
Time's are tough at the moment and Netflix usage is high. We've all got that fear as we come to the end of a series we've been binging - what should I watch next?! So we decided to make this week's challenge all about helping to answer this question. We took a survey of colleagues to find out what they've been watching, what devices they've been using and how they would rate these shows. Unfortunately, the survey was thrown together rather hastily and there's definitely some clean up to be done!   As an extra challenge, typed calculations are forbidden!  That's right, we've got another CLICK ONLY challenge for you to really showcase the power of Tableau Prep. Remember to keep an eye on the recommendations and you are allowed to rename things. Check out this post of all the other click only challenges for inspiration if you're getting stuck! Inputs There are 3 inputs this week: Netflix Survey Results List of all content on U...

2019: Week 17 Solution

Image
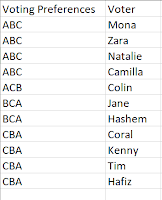
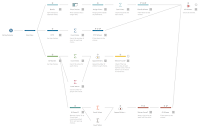
You can find our full solution workflow below and download it here . The full solution workflow. This week there weren’t any specific learning objectives – more just a good chance to apply Tableau Prep to real use cases, such as the issues with choosing a fair voting system. As such there are a ton of different ways of arriving at the final output, none of which are wrong. Apart from perhaps filtering down to 3 lines of data and manually replacing the values with the desired values. That’s kind of wrong and shame on you if you did that. Regardless, below we’ll still present some of the techniques we used to complete the challenge. Bordia Splitting the votes into separate fields In order to create a [1st Choice] , [2nd Choice] , & [3rd Choice] field we made use of the LEFT() , MID() , and RIGHT() functions to pull out the first character, 2nd character, and last character of the [Voting Preferences] field respectively. [1 st Choice] [2 nd C...

2019: Week 17

Image
This week’s challenge comes courtesy of Jenny Martin from DS14 of The Data School and her experience in writing a dissertation on how to rig elections different voting systems: We’ve had a lot of votes in recent years and I’m sure everyone’s just about had enough by now. Naively, I used to believe that the process you use to determine the “winner” of a vote was irrelevant, surely they’re all roughly the same? Then I got to university and discovered this depressing theorem: Arrows Impossibility Theorem For elections with 3 or more candidates, there is no voting system that satisfies the following conditions: ·         Not a dictatorship ·         If everyone ranks A above B, the population should rank A above B ·         If C withdraws from the election, the ranking of A and B should not change.  I thought it would be fun to prove ...