Posts

Showing posts with the label scaffolding

2022: Week 47 - Chelsea Managers per Prime Minister

Image
Challenge by: Stephen Moyse It's been a tumultuous time for UK politics recently, with 3 different Prime Ministers so far this year! Similarly, being a football manager isn't always the most secure a position. So what's the relationship between the 2? Just how many Chelsea Managers have there been for each Prime Minister?  The challenge was a brilliant idea brought to us by data schooler Stephen Moyse and we're excited what other ideas he will bring to us in future! Inputs Prime Ministers  Chelsea Managers  Chelsea Matches  Requirements Input the data For the Prime Ministers data: Group together Sir Winston Churchill and Winston Churchill Split the dates to create Start Date PM and End Date PM For the null End Date PM, replace with today's date Create a row for every day the Prime Minister was in office For the Chelsea Manager data: Remove unnecessary fields and rename remaining fields Clean the Chelsea Managers field For the null End Date CM, replace with today...

2022: Week 43 - Missing Training Data 2.0

Image
 Challenge by: Jenny Martin Good news everyone! Joe was thrilled with the solution we came up with to solve his missing data problem. However, he realised that when he replicated it with the actual data, there was still one part that wasn't quite right.  You see, if the missing training sessions occur on the very first date in the dataset, the workflow we built last week will not fill in the scores since we are only filling down from previous sessions. So in the below example, Agility session would only be filled in from the 4th August onwards. Joe would like the values for the 2nd & 3rd August to be 0.  Input You'll need the workflow you built last week (go back and do the challenge if you haven't yet) An updated Player Training file:  Requirements Replace the input data from last week's workflow with the new datasource In a new branch, keep only the first training session for each player and each session  Work out the minimum date in the entire dataset Ad...

2022: Week 42 - Missing Training Data

Image
Challenge by: Jenny Martin Recently, my colleague Joe Stokes  brought me an interesting challenge that I knew needed to be turned into a Preppin' Data!  He was working with sports player training data. Since the athletes wouldn't take part in the same training sessions every single day, this was leading to a lot of gaps in the data. As there was a metric which calculated the average across all sessions for each day, this could lead to some misleading conclusions, with a lot of variation over time. Instead, what we want is to take the value from the previous session, even if the player didn't partake in the session on that day. This helps to keep the average a bit more stable. It also means we have data for every day, even if the player were off sick that day. Input Our input is very simple, with a row for each training session the player participated in and their resulting score. Requirements Input the data For each player and each session, we want to know what the date is ...

2022: Week 36 - Calendar Conundrum

Image
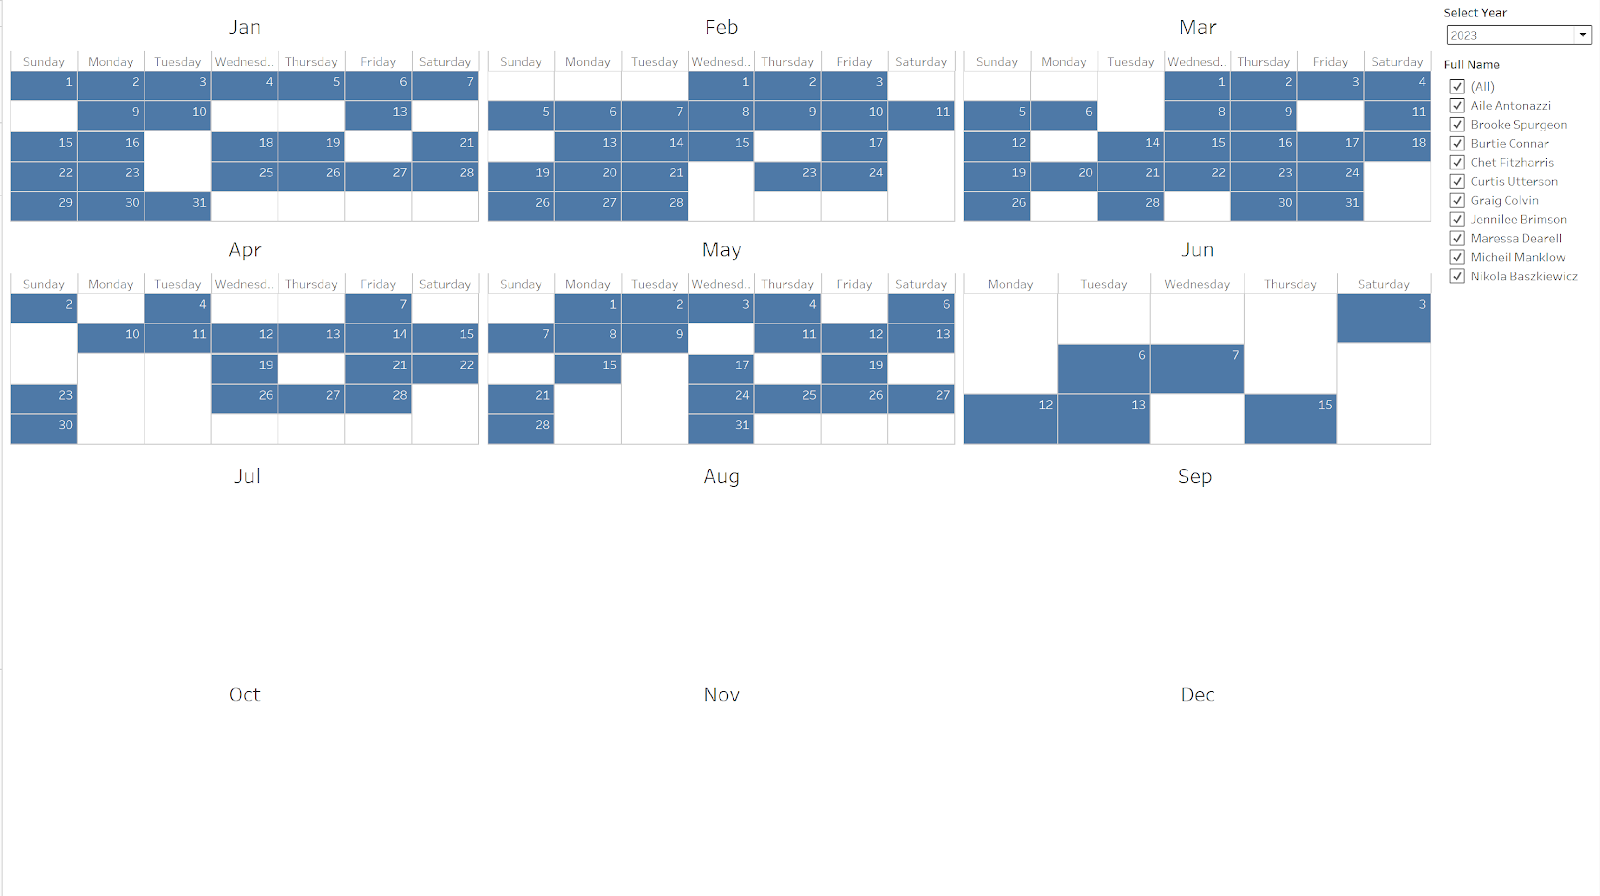
Challenge by:  Jared Flores After beginner and intermediate months, it felt like time to give Carl a break! So here's a challenge submitted by Prep Star Jared: As part of managing your store, you need to know which days you have coverage and which days you still need to schedule. When plugging your data into Tableau to create a calendar, you get this view because you’re missing dates: We need to modify the data so that even dates with no coverage show in the view: Input Employees and their scheduled dates   Requirements Input the data The main challenge is to solve this using only employee_data input Create a Calendar Table Create a date range for the calendar This should be dynamic to handle new data The start of the range should be the based on the year of the earliest date If earliest date is 06/01/2021, the start date should be 01/01/2021 The end of the range should be the last day of the year for the latest date in the data set If the latest date is 06/01/2022 , the end d...

2022: Week 15 Property Management

Image
Created by: Tom Smith (Twitter: @tSmithyyy ) You work for a Property Management company and your boss has asked you to compile a report detailing how much revenue the business can expect to make from its existing office space rental contracts. The time frame in focus is from 2021 until 2026 and the board would like to see a cumulative total for each month of a contract. An additional requirement is to create a dynamic table that totals rent paid for completed years across all contracts, as well as year to date figures for the current year, which would update as time goes on. Input files: Rental Contracts Office Space Prices Requirements: Input the Rental Contracts data Work out the length of each contract in months Work out the number of months until each contract expires (imagine today is 13th April 2022) Input the Office Space Prices data and join it to the contracts table Remove duplicated fields Create a row for each month that a rental contract will be live - Retain the details f...

2020: Week 53

Image
Challenge by: Jenny Martin 2020 - what a year! Much has changed, few things have stayed the same. Even our star signs weren't safe! The introduction of a 13th star sign, Ophiuchus, threw things into disarray. Were you born on a day where your star sign has remained unchanged? Let's make a list of all those affected by the changes. Just a quick thank you for those who have stuck with us in 2020, those who joined us in 2020 and all who learnt something new about Prep!  Inputs Old Star Signs and Date Range  New Star Signs and Date Range  Handy Date Scaffold  Requirements Input the data . Be careful your data isn't mistaken for a header. Reshape and clean up the data so you have a column for the star sign, along with the start and end dates. Create a date range for the new star signs. Scaffold the data so you have a row for every date of the year (2020 is a good year to base this off, since it's even a leap year!) For the output, we're looking for a list of dates that h...

2020: Week 37

Image
Challenge by: Jenny Martin This week we're tackling some questions commonly asked by clients: How do I calculate working days in Tableau Prep? or Is there a networkdays function in Tableau Prep? Commonly, clients are looking to calculate the number of working days between the open and closing date of support tickets, to see if they're complying with their SLAs.  However, I thought we'd choose something a bit more fun for the challenge this week! Instead, let's work out how many days you've worked in a specific time period. This could be since you got your first "proper" job, since you started working for your current employer, days you've worked this year - anything you like! Inputs The inputs will need to be a little bespoke for this challenge. You will need: An input containing the date you'd like to start counting from An input containing information about the number of days holiday you took each year A bank holiday input for your country of r...

2020: Week 25

Image
This week's challenge is a bit of a companion to Week 20's Cipher Solving Challenge , so if you liked that then hopefully you'll be a fan of this too! We're working with Roman Numerals and using the power of Prep to translate them into numbers that we can more easily manipulate in Tableau. In theory, once you've completed this challenge, you could use your resulting workflow to translate any Roman Numeral! Pretty cool, huh? Remember that ordering is very important when reading Roman Numerals... Inputs Requirements Input the data . Find a way to split the Roman Numeral into individual characters (remember, order is important!) Join the information relating to Roman Numeral values. Depending on the ordering of characters in the Roman Numeral, some of these values will need a negative multiplier.  Aggregate the values to complete the translation from Roman Numeral to number. Output the data. Output 2 fields Number Numeric Equiva...