Posts

Showing posts with the label week9

2022: Week 9 - Customer Classifications
Image
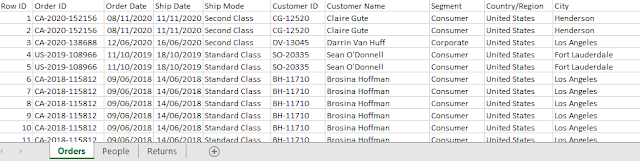
 Challenge by: Jenny Martin Recently, I was doing some Tableau Desktop training that went off on a bit of a tangent. After introducing cohort analysis, I was asked whether we could see the year on year difference in the number of customers. This was answered with a quick table calculation. However, the follow up question of how to get a list of the 158 customers who didn't order again in 2019 had me fairly stumped! After lots of playing around and chatting it through with various colleagues, I came up with a solution that used LODs and Parameters, but all the while I was wishing I could solve the problem in Tableau Prep instead. So of course, I did!  I'm really excited to see the different solutions for this week so don't worry if your instinct is to deviate from the requirements below. Here are the definitions for how we will classify the customers: New = this is the first year the customer has ordered Consistent = the customer ordered this year and last year Sleeping = th...

2021: Week 9 - Working with Strings

Image
Challenge By: Owen Barnes We have a guest contributor this week! Owen has just finished up his training at the Data School and is a regular Preppin' Data participator. So here's his challenge: This challenge will be useful for anyone trying to improve their knowledge of Tableau Prep functions, and their data parsing in general. There is an opportunity to use ReGex in this challenge, but there is a longer workaround with other steps available. There will also be the chance to use LODs in this workflow. We have been given a set of messy strings, which contain useful information that we need to connect to other datasets to eventually find out how much revenue we have generated by selling different products. This string provides us with information such as the quantity of items sold, the product ID code, the phone number of the buyer, and the area code which will let us find out where they are purchasing from. There will also be some small calculations needed to join certain datas...

2020: Week 9 Solution

Image
This week we offer two solutions: one for if you have version 2020.1.3 and one for earlier versions - we used 2019.3.2. You can view the full workflows below or use the following links to download them: 2019.3.2 Solution 2020.1.3 Solution 2019.3.2 Solution 2020.1.3 Solution Both flows begin with the same preparation steps so we will indicate when our solution post splits for each specific version. 1. General data preparation This section is for both versions and includes: Removing the averages. Calculating the sample types. Cleaning up the dates. Pivoting the candidates. Removing the null results. It is after pivoting the candidates that the solutions for each version diverge. 1.1 Removing the averages Within a Clean step, locate the "RCP Average" value within the [Poll] field. Right-click on it and select "Exclude". 1.2 Calculating the sample types In the [Sample] field, each value ends with either "LV" or...

2019: Week 9 Solution

Image
First let me preface this write-up by stating that these complaints make up the minority of our feedback – most of our customers are incredibly happy with our products and we have won all lawsuits against us. Not that any lawsuits occurred. But if they did, we won them. This week I’ll once again be covering some of the main challenges faced and techniques used to overcome them. You can view our whole dynamic solution below and download it here (you can also find a less dynamic but also viable solution there too!). The Bug One of the main issues involved in this week’s challenge was finding away around a known Tableau Prep bug. As of 2019.1.3, the “ All ” option in Automatic Split and Custom Split allows you to split a text field on every instance of your chosen delimiter. No more capping at splitting off the first or last 10, hooray! However, this only applies when you’re using the split on an untouched field from your data source. If you create a calculated field that c...

2019: Week 8 Solution

Image
This week on Preppin’ Data we once again had you all serve as labour for Chin & Beard Suds Co. It was quite a tough one! In order to overcome this challenge, our method uses a number of techniques from previous challenges. We mentioned at the bottom of the requirements that we used the Rows-to-Column pivot and another key hint provided was: although you had five questions to answer they can all be answered using the output data-set provided. What is this hinting at? Using the Profile Pane to answer questions! Before we dig into a few of the main challenges in the workflow itself, let’s take a look at the answers to the 5 questions themselves. 1) Whilst we can see both bar and liquid soap has been stolen in similar frequencies, the liquid soap has been stolen in much greater quantities. 2) & 3) We can see that 19 items of stock haven’t been updated yet: 5 in 'Wimbledon 2' and 14 in 'Oxford Street'. 4) The only store to update its stock in 1 day o...