Posts

Showing posts from September, 2019

2019: Week 32 Solution

Image
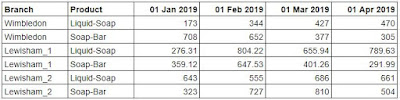
You can view our full solution workflow below and download it here ! Our full solution workflow. 1. Pivot the products and associated sales. The first step in our workflow is to convert the [Product 1] & [Product 2] fields and the [Sales] & [Sales 1] fields into two fields, [Product] & [Sales], so we have one product and one sales value per row. To do this, we can use a column to rows pivot. First add the two product fields to Pivot1 Values. Then, add a second set of pivot values using the ‘+’ icon underneath the pivot type drop down. Finally, add the two sales fields to the Pivot2 Values area. Take care to align [Sales] with [Product 1] and [Sales 1] with [Product 2] as this ensures they are on the correct rows together Pivoting the Products & Sales into their correct rows. 2. Remove the dashes from the product names. Either in a clean step or in the pivot step we just used, update the new [Product] field by creating a new calculated field with the

How to... deal with Dates

Image
Sorry to anyone looking for dating advice - this isn't for you. For those who are battling dates in their data sets, then this is for you!  Why are dates important? A basic date field can start to tell us so much: How many sales were made on Saturday? How many students joined the programme this term? How many games does my team play this month? All of this can be formed by counting the number of rows and breaking this down by the different parts of the date. What do we mean by parts of dates? When most of us think of dates we think of days, months and years. Depending on which side of the Atlantic Ocean we are on depends on whether the months or days come first in that order. We are Brits so will unapologetically put days before months for the rest of this post.  The date format we commonly use are dd/MM/yyyy or, for example, 25/09/2019. The 'd' represents the day part and as we have two digits to represent the day then we use 'dd'. 'M' st

2019: Week 33

Image
Chin & Beard Suds Co management team have heard there is unrest in a few of their Northern stores and asked their HR data manager to pull together some supporting files. Sadly for us, those files are going to take some data prep to ensure we can conduct the analysis we want to.  Leeds Store Staff   Sheffield Store Staff Salary Ranges Store Sales The rumours we've heard are: We are paying people more than our Corporate Pay Ranges that we have agreed Bonuses account for very little (less than 10%) of someone's salary We want your help to answer these questions for us. There are some contractual pay conditions you should consider: Bonus will be paid as long as you are still an employee for at least the 1st day of the final month of the quarter. Consider only employees who received salary during 2019 Anyone paid above the salary range will receive no bonus (we pay them enough already) Assume today's date for the analysis is 1st October 20

2019: Week 31 Solution

Image
You can view our full solution workflow below and download it here ! Out full solution workflow. 1. General preparation: pivoting statuses. The first stage towards all four outputs is to get all the [Date]s for a single [Order] onto the same row, giving each [Date] the appropriate [Status] field name. To achieve this, simply use a Row-to-Columns pivot. Put [Status] onto ‘Pivoted Fields’, and put the MIN or MAX of [Date] onto the aggregation section We can take MIN or MAX as there is only one [Date] per [Status] per [Order], so MIN & MAX are one and the same. Pivoting the statuses. 2. Get preparation: getting the time between dates. The second stage of general preparation is to calculate the [Time to Send] and the [Time to Review from Sending Order]. To calculate these we can use the DATEDIFF() function to get the days between [Purchased], [Sent], and [Reviewed] [Time to Send] [Time to Review from Sending Order] DATEDIFF('da

2019: Week 30 Solution

Image
You can view our full solution workflow below and download it here ! Our full solution workflow. Just a foreword on this solution: this workflow has gone through a number of iterations as small quirks are located and corrected, so if your results don't quite match then that's fine! As long as you have a final data set with roughly 31k rows, 7 fields, a logical looking [Comment Split] field, and Celcius temperatures that are both positive & negative then you've done great in my eyes. 1. Exclude all non-temperature Tweets. We need all Tweets that have a date, then water temps, then air temps. Filtering on “: Water –“ does the job here, though we could use Regex to ensure every Tweet fits the matching pattern. The filter settings. 2. Extract the temperatures. There’s two main methods here: Use the SPLIT() function to extract the correct chunks of text. Use REGEX_EXTRACT() to match on patterns.  In our solution, I opted for RegEx, but that was most

How to...Plan your Prep

Image
So you know your data isn’t right for the purpose you need it to be; but what do you do about it? The next stage in this process after this realisation is key in developing a solution to your challenge but how do you approach this next step when all you see are the issues in front of you? Our approach to this challenge is a staged approach that should help you plan, define the outcome and provide a framework of steps to solve your challenges.  To cover this, let’s talk through an example data set, but keep it simple. Here’s some sales data from Chin & Beard Suds Co (a fake retailer that sells soap).  Stage 1 - Know Your Data Without understanding your dataset as it currently stands, you will not be able to deliver the results you need. Sometimes in small datasets, this understanding can be very easy to form. Here’s what to look for in small datasets: Columns, rows and crosstabs - how is the data structured? Two columns of dimensions with each other column a mon

2019: Week 32

Image
At Chin & Beard Suds Co, we have come across another data challenge where customers who buy multiple products have their products held in a slightly complex way. Each product is listed in it's own column so two products sold leads to two separate product columns. You challenge is a fundamental one this week, to create a more logical way to hold this data. We've thrown in an address clean up challenge for you too just to spice things up a little! US Zipcodes are a lot easier to understand than UK Postal Codes so enjoy the oddity if you are not used to them! Requirements Input data Provide the address columns specified in the output Put all the products in one column, same for sales Clean the product names to remove punctuation Output 7 Columns Property Number Town Postal Code Country Product Sales 12 Rows (13 including Headers) The output can be  found here  for comparison. Don't to forget to fill in our  participation tracker  and share