Posts

Showing posts from November, 2021

2021: Week 47 - Solution

Image
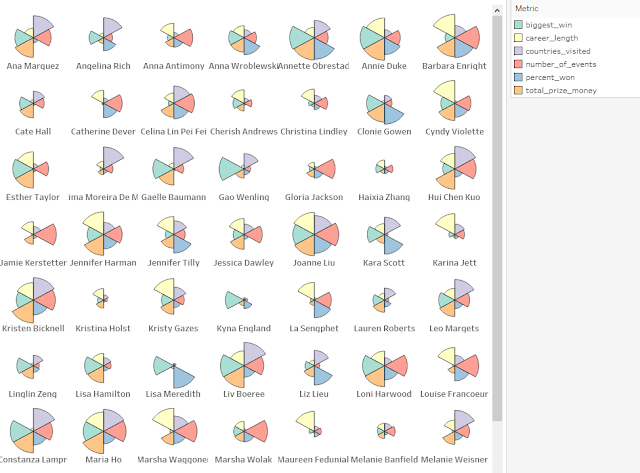
Solution by Tom Prowse and you can download the workflow here. Also, Will has provided the solution in R which can be downloaded here . The challenge this week was a cross-over with the new community project  #GamesNightViz  and #PreppinData regular Will Sutton . The challenge was to recreate a Pizza chart all about the top female poker players across the world.  Step 1 - Combine Players & Events The first step is bring both of the tables in our input into the workflow. From here we can then use a join to combine them together.  The join condition is where player_id = player_id:  We can then tidy up the table be replacing any nulls in the 'prize_usd' field with a 0 and also calculating the number of wins for each player using: Wins   IF [player_place]='1st' THEN 1 ELSE 0 END Then finally we want to know how many events each player attended so we can calculate this using a FixedLOD calculation, where we group by 'player_id' and then CountD 'Event Name

2021: Week 47 - Games Night Viz Collab

Image
 Challenge By: Will Sutton Did you see the launch of #GamesNightViz a couple of weeks ago? It's a new community project which gives you the opportunity to practise your data visualisation, design and preparation skills. So we've decided to team up this week to bring you a #GamesNightViz style Preppin' challenge!  This week's challenge is about building new dimensions from #GamesNightViz's Top Female Poker Players data to better understand their successes across their poker careers. They've earned millions of dollars but was it all in one go? How many years have they been playing poker? How regularly do they win?  The resulting dataset will allow you to build a pizza plot/coxcomb chart like below, which you're welcome to do as a bonus challenge too! Inputs Top 100 Female Poker Players  Top 100 Poker Events  Requirements Input the Data Add the player names to their poker events Create a column to count when the player finished 1st in an event Replace any null

2021: Week 46 - Solution

Image
Solution by Tom Prowse and you can download the full workflow here .  This week we turned our focus onto the Tableau Desktop relationship model and how we can build the physical layer of the data model using various aggregated and conditional joins. We are using the classic example of the Bookshop so let's look how we can solve the challenge! Step 1 - Sales Data The first step is to bring all of the sales data into the workflow. This is split into 4 separate sheets (1 for each quarter) therefore we can use a 'Wildcard Union', within the input step, to bring all 4 sheets in together.  To make sure we are bringing in the correct sheets, we can use the matching pattern of 'Sales Q*' to make sure we are bring in the 4 different sales sheets.  From here we can then remove the File Path & Table Names fields that have been auto generated after the union. At this stage we should have 56,350 rows, and this number should be replicated throughout the challenge. Step 2 - Jo

2021: Week 46 Book Shop Data Modelling

Image
 Challenge by: Carl Allchin      For any Tableau Desktop users, the relationship model being introduced in 2020.2 created a very different way of working with data. The aim of the new functionality was to remove the complexity of having to think about tying multiple data sets together. If you've worked with multiple data sets before, I'm sure you've stumbled across a time where the number of rows in your resulting data set formed by your joins has exploded to a large number from what you initially had.  Relationships makes use of: Smart Aggregations - avoid duplication of values that come from a join condition that links one row to many rows in the other data source Conditional Joins - uses different types of joins depending on what the model assess that you are trying to do within your visualisation.  This flexibility comes from Tableau creating a 'logical data model' that it then flexes. If you've created Joins and Unions before then you will have built a '

2021: Week 45 - Solution

Image
Solution by Tom Prowse and you can download the workflow here. It was Tableau Conference week so it was time for a themed challenge, and this year we focused on Braindates! With lots of knowledge sharing happening between different meetings, we wanted to know how many people will you indirectly gain knowledge from as you attend brain dates?  Step 1 - Session DateTime The first step is to input our data for each of the Brain Date sessions. This is in the form of 3 separate worksheets (one for each day of the conference) and they are all structured in the same way, with the same fields.  Instead of bringing each of the three session sheets in as separate inputs, we can use the Wildcard Union within the input tool to bring in all three sheets. Using the matching pattern of '*Nov' will bring in any sheet with the word Nov at the end. Once we have input the data we can start to create a datetime for each of the sessions. The time of the session is included in the original worksheet

2021: Week 45 - Spread the Knowledge for TC

Image
 Challenge by: Jenny Martin Tableau Conference 2021 is here and we thought we'd put together a challenge themed around Brain Dates to celebrate! The idea is, how many people will you indirectly gain knowledge from as you attend brain dates? The people you're meeting with will have been to other brain dates across the conference, so they will be able to share their key insights and the collective knowledge will grow with every brain date held! I had a lot of fun putting this challenge together, even needing pen and paper at times to work out the final output, so I hope you'll enjoy putting your Preppin' skills to the test with this challenge too.  Inputs The brain dates for each day are spread across 3 excel sheets:  There is also an Attendee ID Lookup table contained within this excel workbook:  Requirements Input the Data Create a DateTime field for each Session Create a row for each Attendee and Join on the Lookup Table Create a Direct Contact Field for each Attendee