Posts

Showing posts from February, 2022

2022: Week 8 - Pokémon Evolution Stats

Image
Challenge by: Will Sutton In this week's Preppin' Data we're collaborating with #GamesNightViz on their latest challenge Power Ups . We'll be diving into the Pokédex to explore how Pokémon combat stats change when they evolve. Inputs pkmn_stats  pkmn_evolutions  Requirements Import the data (excel file) From pkmn_stats dataset remove the columns height, weight and evolves from Pivot (wide to long) pkmn stats so that hp, attack, defense, special_attack, special_defense, and speed become a column called 'combat_factors' Using the evolutions data look up the combat_factors for each Pokémon at each stage, making sure that the combat_factors match across the row, i.e. we should be able to see the hp for Bulbasaur, Ivysaur and Venusaur on one row Remove any columns for 'pokedex_number' and 'gen_introduced' that were from joins at Stage 2 & 3 If a Pokémon doesn't evolve remove it from the dataset Find the combat power values relating to the Po

2022: Week 7 - Solution

Image
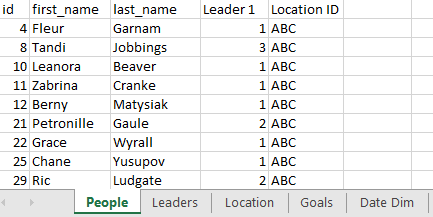
Solution by Tom Prowse and you can download the workflow here.  This week's challenge comes from   Tableau Social Ambassador  Kate Brown .  In the challenge with want to combine various tables to help us monitor our metrics within the call centre. This is trying to replicate the scenario where you connect to a database table that has ids and another table with descriptor for those ids. Step 1 - Location, People, & Leaders The first step is to input the tables from the PeopleData Excel file. At first we want to bring in the Location, People, and Leaders tables and then combine these into a single table. First we can join the Location & People by using the Location ID field: Then we can join the Leaders table onto this by using Leader 1 = id:  The final step here is to clean the Leader and Agent name fields so they are in the correct format. We can do this by using string calculations:  Leader Name   [last_name-1] + ', ' + [first_name-1] Agent Name [last_name] + '

2022: Week 7 - Call Center Agent Metrics

Image
Challenge by: Kate Brown This week we have another incredible challenge created by Tableau Social Ambassador Kate Brown : For this week’s challenge we need to create a data set for our call center agent metrics. We have 2 Excel files that contain the monthly metrics for the agent and another file that contains the agent, leader, location, and goals.  If you work with databases you may encounter situations were you have one table that has ids and another table(s) that have the descriptors for those ids. We aren’t connecting to a database in this example, however, think about the people, location, leader, and date inputs in that way. Inputs People Data: People  Leaders  Location  Goals  Date Dim  Metric Data 2021: Jan - Dec Requirements Input the data People, Location, Leader, and Dates: Join the People, Location, and Leader data sets together Remove the location id fields, the secondary leader id field Create last name, first name fields for the agent and the leader Limit the dates to j

2022: Week 6 - Solution

Image
Solution by Tom Prowse and you can download the workflow here.  This week we take a look at something a little different compared to The Prep School challenges. This challenge is a bit of fun and we look at the likelihood of scoring big with a 7 letter word in Scrabble.  Step 1 - Input Scrabble Scores The first table to focus on is the Scrabble Scores sheet. This contains all the information about the scores and tiles within a game of Scrabble. However, all of this information is within the same field therefore we need to split this out so that we have three individual fields instead.  To do this we can use the custom split functionality to first extract the Points. We could do a split on the ':' symbol, however to make things a little easier we can just return anything before the first occurrence of the word 'points:': We can then make this a whole number and rename to Points.  Next is the tile and frequency information. This is a little harder but we want to use a cu

2022: Week 6 - 7 letter Scrabble Words

Image
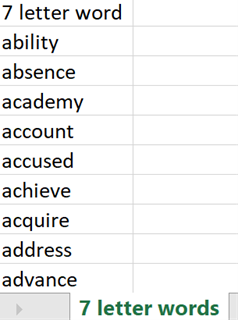
Challenge by: Jenny Martin For this challenge, we're going to take a look at 7 letter words which could be potentially high scoring in Scrabble and work out the likelihood of drawing the tiles needed to create this word. Are we going to make our lives easier by assuming that each tile drawn is an independent event and that the order tiles are drawn is irrelevant? Yes, but equally, if you have the statistical brain to calculate the probabilities as dependent events, considering all the possible orderings then we'd love to see that solution!  Inputs 7 letter words  Scrabble Scores  Scaffold (which you may or may not need!)  Requirements Input the data Parse out the information in the Scrabble Scores Input so that there are 3 fields: Tile Frequency Points Calculate the % Chance of drawing a particular tile and round to 2 decimal places Frequency / Total number of tiles Split each of the 7 letter words into individual letters and count the number of occurrences of each letter Join