Posts

Showing posts from July, 2019

2019: Week 25 When PD met Workout Wednesday

Image
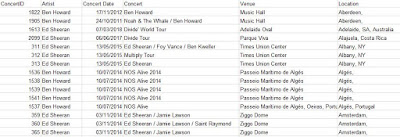
When Lorna suggested we set-up a challenge for Tableau users to not only complete a Workout Wedesday live but use Tableau Prep Builder to prepare their data then we jumped at the chance to collaborate. This week is held as a live session (I'm waving if you are in the room and if you're not here, you're welcome to take part too) so we have built a combined challenge that should only take a few hours in total even if you new to either tool. So what's the challenge? To celebrate Tableau's Music month Lorna found a great data source on one of her favourite artists (Ed Sheeran) that led me to ask a question about one of my faves (Ben Howard). We want to analyse the two artists careers based on their touring patterns and as two UK-based singer-songwriters who appeared on the UK music scene at similar times, how have they developed. The Preppin' Data part We have taken the gig history from concertarchives.org  and done a little pre-cleaning as we wanted the ch

2019: Week 24 Solution

Image
You can view our full solution workflow below and download it here ! Our full workflow solution. This week saw our first official foray into the world of RegEx. There’s a lot to learn when it comes to RegEx and some great resources to help are https://regexr.com/ & https://regex101.com/. In this solution post I’ll highlight the functions and RegEx we personally used as well as the overarching method for our solution. I'll break down the RegEx within the first calculation, however for the others and for a better understanding I'd recommend using one of the aforementioned resources which help break them down - I find Regex101 is particularly good for this. Use REGEXP_EXTRACT() to find and pull out information REGEXP_EXTRACT() is a function that allows you to look within a string and extract the first instance of a specific combination of characters. It takes two parameters: The string/string field. The RegEx that defines the character string you’re looking for.

2019: Week 24

Image
Previously on Preppin' Data... (I'm still a 24 fan) a lot of Data Schoolers  have been working through the challenges and this week they wanted to post their own so a big thank you goes out from Jonathan and I to Kamilla and Bona of our fourteenth cohort at the Data School for this challenge. They don't know whether it's too hard or not so please let them know! Both of the challengers this week love to use regex so wanted to give those who haven't had the chance to use the language before the chance to explore it. If you want to stick with the string calculations you can but it might be a little tougher! If you haven't used regex before then the team recommend you use  https://regexr.com/  to help you get to grips with what is going on. With all of that in mind, what is the challenge? Analysing messages from the Data School What's App group. Don't worry we are not sharing any insights in to what the Data Schoolers think of their coaches (phew!) a

2019: Week 23 Solution

Image
You can view our full solution workflow below and download it here ! Our full workflow solution. Wildcard Union. Importing the data The very first requirement is to import all the sheets from the input data. The quickest way to do this is to simply drag one of the sheets from the connections pane onto the canvas and select the 'Wildcard Union' option. By default this option will include all sheets within an Excel file and union them together! We want to remove the [File Paths] field but leave the [Table Names] field as it contains date information that we'll need later when calculating the actual dates for each row of data. Calculating the dates There's two stages to calculating the exact dates here: Stripping the 'week commencing' date from the [Table Names] field. Converting the [Day] field to something that we can add to the 'week commencing' date. Stripping the WC date Getting the [Week Commencing] date. There's a vas

2019: Week 22 Solution

Image
You can view our full solution workflow below and download it here ! The full workflow solution. This week we were working on recreating another table calculation – this time to moving average. This specifically example recreates the following Tableau Desktop settings: Tableau Desktop moving average settings. For each date in our data this provides us with a 1 week moving average which uses the current days sales & the past 6 days of sales and returns NULL for any date that doesn’t have at least 6 previous days. There are 4 stages to our workflow: Duplicate the data and subtract 6 days from each date. Join the duplicated days together so each date now has 7 rows; one for each day being used in the average. Aggregating to calculate the average. Adding NULLS where appropriate and rounding the results. Duplicating data and subtracting 6 days from each date The duplication and date calc section. In order to calculate our moving average we need to join th

2019: Week 23

Image
We need to talk about Dave... he's a good salesman but he's not our analysts' best friend. Dave is "too busy" to consistently enter his data. He likes to sometimes hit CAPS LOCK. Does Dave even know the shift key exists? Our challenge this week is to tidy up the messy data Dave has left behind him by creating a nice data set so we can analyse his sales, favourite customers etc. Requirements Input Data Bring in all tabs of the Excel Sheet Create the date of the sale Create a column for the scent of the product Create a column for the product Create a column for the customer name - with the customer's name in Title Case  Output One file 6 columns of data 18 rows of data (19 rows including headers) No nulls For comparison,  here's our output files .  Don't to forget to fill in our  participation tracker !

2019: Week 22

Image
As heavy Tableau users at Chin & Beard Suds Co, our users keep asking us to show if it is possible to create a Moving Average. As any Tableau User will know, this is super easy to set up in a table calculation  but harder to do at the data preparation stage to hard code that value for use in other calculations that you might want to have happen earlier in Tableau's Order of Operations . Therefore, this week is focused on our daily sales at the start of 2019 and how we can work out the weekly average (using the 7 days before the current date) to work that out. Requirements Input Data Determine the weekly average sales for the current day and the previous six Don't create a moving average if it isn't the average of seven days sales. Clean-up the data for output by removing unnecessary columns Outputs One file 3 columns 365 rows (366 rows including header) For comparison,  here's our output files .  Don't to forget to fill in our  part

2019: Week 21 Solution

Image
You can view our full solution workflow below and download it here ! The full workflow solution. The USP of this week’s challenge was the fact that it required you to build upon a previous solution and work in new data and new analysis. Whilst some of the original flow could be left as it was, the freshly updated section is highlighted below. The updated section (within the yellow boundary). Adding new patients To add in the new patients, we can simply add the new CSV as a data source and drag it onto the canvas. We can then use a Union step to create one long list of all the patients and the dates they first visit the hospital. Finally, we can merge the misnamed [Name] & [Patient Name] together by: a) Selecting both fields and then clicking merge fields. b) Drag one field on-top of the other and dropping it to merge the fields. c) Renaming one of the fields ahead of time to match the other. Adding check-up dates Since all patients require check-ups we ne

How to... Aggregate in Prep Builder

Image
Prep Builder helps Tableau users prepare their data for fast, agile visual analysis in Tableau desktop due to the look and feel being so familar. That is until so of the common features of the tools differ. When I'm teaching Tableau Prep Builder, aggregation is a common source of that pain. What is Prep Builder doing similar to Desktop calculations? Like Desktop, Prep Builder will work each calculation out at a row level if you don't use any form of aggregation. For example, if I wanted to work out the Total Cost in this simple dataset, I am simply adding one value to the other, one row at a time: The dataset is here as an Excel workbook if you want to use it To add these costs together, we would write the same calculation in Prep as we would Desktop: This results in each of the values getting added together for each row, with a new column being created to hold that value: The value created and the additional column to hold the value is identical be

2019: Week 21

Image
This week is a continuation of the challenge that we started last week. As a recap, check the challenge post from Preppin' Data week 20 . Like any data project, new data is flowing in continually and our patient data is no exception. Sadly this week, we have received a CSV file instead of XLSX and we seem to have a different column name too... the joy of manual data capture. Also, last week, we had included an additional tab of data that we didn't set any requirements for (although some of you jumped in and worked with that anyway!). The unused data was all about check-ups and how much additional cost they will place on Chin & Beard Suds Co. The same cost model is used but each check-up is classed as an individual visit. Requirements Add new Patient Data Add Frequency of Check-Ups data Use Frequency of Check-Ups to determine when a patient will re-enter hospital by using Frequency from the date the patient leaves hospital Understand the additional cost incurr