Posts

Showing posts from November, 2019

2019: Week 42

Image
In Week 26's challenge , we took the opportunity to use only mouse clicks in Prep to see how far we could prepare some data for Chin & Beard Suds Co. This time, the challenge has more elements as the Tableau Prep development keeping adding wonderful features. Things you might want to look out for this week to help: - Data Roles: This 'How to...' post will be useful if you haven't used them before - Prep's recommendation icon  This week's challenge involves helping Chin & Beard Suds Co. go global. We are looking to expand our stores' footprint overseas and therefore need to look at potential costs and returns from those potential sites. An agency has done lots of the work for us but they aren't the best at data entry. They've sent a messy file that they haven't had time to clean up so any inaccurate data should be removed. Don't worry folks, we won't be using them again! Requirements Sheet 1 - The Main Data Set Cu

How to...deal with Sampling Datasets

Image
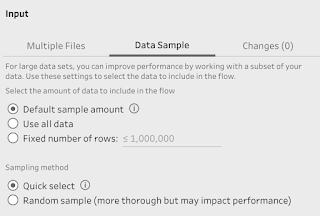
To Sample or Not to Sample?  That is often the question for data preppers. In the world where data volumes are growing, storage solutions are getting cheaper and data creation is easier than ever - understanding when to sample datasets is becoming a key skill in the Data Preparation process. One simple rule... All if possible The reason why we use data is to find the story, trends and outliers within it so to make better decisions in our everyday and working lives. Therefore, why not aim to use all the data and information you can to do that? Using the full data set is not always possible though. The reason why Preppin' Data exists is because data often needs to be prepared for analysis. Some data is so messy or uncomputable that we have no choice but to remove it. This challenge is not what we mean by sampling though. Sampling is about using a subset of the full data set - not because the data can't be cleaned but for lots of separate reasons. So why should you sample

How to...deal with Numbers

Image
For many people, when you say “data”, they actually think about numbers. Numerical data sits at the heart of most of our analysis and therefore, being confident and comfortable with numbers is key to successfully preparing data for analysis and sharing. In this post we will cover what considerations you will need to make when using numerical data. For example, the format of your numbers will significantly change your analysis.  What do we mean by numbers? If only we had to think about 0, 1, 2, 3, 4, 5, 6, 7, 8, 9. These characters obviously form the basis to using numbers in data analysis but there is much more complexity than that. Numbers will often be the focus of your analysis, for example: What is my total sales? How many staff work in our organisation? How many customers have we sold to? What percent of suppliers have billed us? We commonly call these numbers the ‘Measures’ of our data. Our analysis will typically be comparing these measures or breaking them dow

2019: Week 41

Image
This week our customers here at Chin & Beard Suds Co are not happy. We have received a number of complaints about products which we have recently shipped. We’re always upset to have disappointed customers and we have recently implemented a new policy regarding complaints. If a customer is unhappy with a product, we will refund this item. However, if more than 20% of items shipped from one batch receive complaints, then we will recall the whole batch and therefore lose money on the entire batch.  We want to know how much money we’re going to lose from refunds alone, from recalling whole batches, and the total of money we have lost. We would also like to find out what our stock levels are looking like after dealing with all these complaints.  Unfortunately, these complaints have not been recorded in the best of ways. Each row of data contains an order number, customer number, item number and the complaint itself. We also have a table of all our orders and another containing

Data 19 - PREParing for my next Steps

Image
Since starting Preppin’ Data, Jonathan and I have been overwhelmed with the conversations we’ve had with the burgeoning Prep community that is starting to emerge. Lots of that conversation has been with the amazing Development team that turns some bits of computer code in to a data super power for the tools users. Without sharing any secrets, I thought I would talk through my reflections on the new features and capabilities that the team have created and what the other members of the Prep community are thinking about too. Overview: The Prep community feels small (for now). Those lucky enough to use the main Prep Builder tool are raving about how simple the  User Interface makes preparing data sets. Many of my links in the Tableau community are teachers and this shows in the conversations I had. Not only are those individuals involved in the those chats enjoy the quick results but they were all more excited about lowering the barrier to entry for self-service data prep that Pr

2019: Week 40

Image
This week is Tableau Conference week. A major conference happened last week and they need some Data help! Sudzilla, the annual conference for all things soap, was attended by our very own Chin & Beard Suds Co. A survey was sent to all participants and the results are in but the structure of the data isn't ideal for the analysis we want to do. Summarising survey responses to understand the overall event is challenge. One metric that often gets used is Net Promoter Score (NPS) . This takes the questions "On a Scale of 0-10, would you recommend [Enter Event / Product] to friends and family?" and converts it in to a percentage score. The reason why NPS is better than traditional satisfaction scores is the customers who have poor experiences will do damage to your brand (detractors) rather than just looking at those who are promoting your brand (promoters).  Through research, Promoters were found to be those who gave scores of 9 or 10. Detractors were a large ra

How to...handle Prep errors

Image
***Disclaimer - Prep is rapidly developing so we will try to edit this post to keep up but some 'knowledge' might age but we'll do our best*** Errors in software suck. Who hasn't spent time crying into their keyboard or banging their head against their screen asking the computer gods to find a solution to their problems? Agreed - no one! At Preppin' Data, we are fortunate to have taught a lot of people self-service data prep and Tableau Prep so have a good view on common mistakes people make with the tool. This post will address some of those common issues and pose some potential solutions. Here's a list of the errors we are going to cover: Parameters Blank profile and data panes Where's my input file?  Why is my input showing as rows rather than columns of data? Whole numbers vs. decimals Parameters "...But parameters aren't a thing in Prep" I hear you all cry - correct but you will see this error message a lot: For those

2019: Week 38 Solution

Image
You can view our full solution workflow below and download it here ! Our full solution workflow. There are 3 aggregations required for this challenge. We’ll tackle the easier two first. Aggregate to get the total patient visits and first visit dates After importing the data simply create a new aggregation step with the following settings: GROUP on [Patient ID] COUNT DISTINCT [VisitID] fields and rename to [Total Patient Visits]. You could also SUM the [Number of Rows] field for this. Take the MIN of [Date of Service] and rename to [First Visit Date]. Aggregating to get the total patient visits and first visit dates. This gives us the [Total Patient Visits] and [First Visit Date] s for each patient. We can now set this to one side whilst we go back and perform the last aggregation required. Use a self-join & aggregation to number the visits. We now need to number each patient’s visits so that their first visit is number 1, second visit is number 2, an

2019: Week 39

Image
The Head Honchos of Chin & Beard Suds Co want to understand how their website is performing. Are the web pages being tested on the right devices and Operating Systems? Are we considering language and cultural references? To conduct this analysis, our website stats are held in a frustrating way but this analysis won't be done just once so we want to set up the flows so they are available in a reusable way to conduct this analysis whenever needed.  Requirements Input the Excel workbook Create a single table for each of Origin, Operating System and Browser Clean up values and percentages Convert any < 1% values to 0.5 If percent of total fields don't exist in any files, create these and make them an integer Create a consistent output for all three files Outputs 3 Files with the following 6 columns: Type (either Origin, Browser or Operating System) Change in % page views This Month Pageviews Value This Month Pageviews % All Time Views Valu

2019: Week 37 Solution

Image
You can view our full solution workflow below and download it here! Our full solution workflow. Use a wildcard union to import all the data. When importing the six different files, we could individually add each file to the canvas and then use five union steps to combine them. A much more efficient and dynamic solution is to add one of the files to the canvas and then use a Wildcard Union . Wildcard Union input settings. Drag one file onto the canvas. Select the Wildcard Union option. If the folder with the files in has no other files in it then click Apply . If the folder with the files in has other files in it, or may have other files in it in the future, then set a Matching Pattern to ensure only the appropriate files are imported. A matching pattern for this import could be: MOCK_DATA-*.csv . Click Apply after setting the matching pattern. After clicking apply, a new field called File Paths should appear in the table of fields. Make sure this is ticked as