Posts

Showing posts with the label Pivot

2022: Week 45 - Strange Table Structure
Image
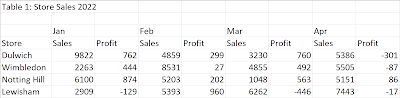
 Challenge by: Jenny Martin This week we're working with a dataset that's very easy for humans to read, not so easy for Tableau. Let's restructure it to make it Tableau friendly. Warning in advance: this may involve creating many separate branches in your work flow! Input In this dataset, we have the Months going along the top of the table. The row below then gives the Sales and Profit measures for that Month.  Requirements Input the data Split off the Year from the first row of data Pivot the remaining rows  Remove the 'F' from all of the F1, F2 etc field names so we have row numbers Reshape the data so each row has a Month associated with it Reshape the data so the values fall under either Sales or Profit Create a Date field using the Month and Year fields Output the data Output 4 fields Store Date Sales Profit 40 rows (41 including headers) You can download the  full output here .  After you finish the challenge make sure to fill in the  participation tr...

2022: Week 37 - Elden Ring Adventure

Image
Challenge by:  Will Sutton It's time for another collaboration with  #GamesNightViz ! Over the last few months, the #GamesNightViz team have been playing Elden Ring which has inspired this challenge. We’re looking for the highest damaging weapons we can use throughout our playthrough. Using data tables from https://eldenring.wiki.fextralife.com/Weapons we have the base stats for all the melee weapons however, it’s a little messy!  The goal is to create an output of the highest damaging weapon by its required level. Input A rather wide dataset! Don't worry, it'll be explained in the requirements which fields we need and what the values mean. Requirements Load the dataset  - updated 14/09 Split the dataset into two tables Damage Stats: 1 containing: Name, Category, Phy, Mag, Fire, Ligh, Holy Level Requirements: 1 containing: Name, Str, Dex, Int, Fai, Arc For Damage Stats, if you look at the data in Phy, Mag, Fire, Ligh, Holy: the first value shows the attack damage...

2022: Week 26 - Making Spotify Data Spotless

Image
Challenge By: Algirdas Grajauskas It's always great when a Data Schooler in training comes up with an idea for a Preppin' Data Challenge! Al is part of DS31 and has been in training for 3 months now. For this challenge we're going to clean up and analyse his Spotify data.  Input Unclean Spotify data – from Spotify  Requirements Input the data Create a new field which would break down milliseconds into seconds and minutes e.g. 208,168 turned into minutes would be 3.47min Extract the year from the timestamp field Rank the artists by total minutes played overall For each year, find the ranking of the artists by total minutes played Reshape the data so we can compare how artist position changes year to year Filter to the overall top 100 artists Output the data Output 10 fields Overall Rank Artist Name 2015 2016 2017 2018 2019 2020 2021 2022 100 rows (101 including headers) You can download the  full output here .  After you finish the challenge make sure to fill in ...

2022: Week 25 - Housing Happy Hotel Guests

Image
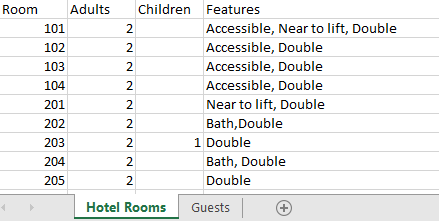
Challenge by: Jenny Martin Imagine you're working at a hotel and the process of assigning guests to hotel rooms is very manual and often based off the expertise of those that have worked in the hotel for a long time. You've managed to pick the experts' brains to get a comprehensive list of the features of each hotel room and you want to build a simple proof of concept workflow that would allow users to immediately see which rooms would be suitable for each guest. We're not worrying about assigning guests to rooms just yet, this is just the first step to proving how an automated workflow could help to make life easier! For a room to be suitable for a guest it must: Have enough capacity for all adults and children in the party (no one's allowed to sleep on the floor!) Have either double or twin beds as per the guest's preference Be accessible if the guest has accessibility requirements Satisfy as many of the additional requirements as possible Inputs Hotel Rooms  ...

2022: Week 16 - Restaurant Orders

Image
Created by: Jenny Martin The Preppin' Data team are planning to go out to dinner. However, the system the restaurant has used to collect orders doesn't provide the chefs with the easiest way to understand what they should be making. To help things go swimmingly on the night, as well as for all other guests using this ordering system in the future, we'll create a workflow to only show the ordered dishes for each guest. Inputs Orders from Guests  Recipe ID lookup table  Requirements Input the data Reshape the Orders table so that we have 3 columns: Guest name Dish Selections (containing 🗸 or null) Extract the course name from the Dish field Group these so that Starter and Starters are treated the same, for example Fill down the course name for each Guest ( hint ) It may help to bring in the Recipe ID from the Lookup Table  Where the Dish contains the Course name, it may be helpful to replace the Recipe ID in the following way: Starters = 1 Mains = 2  Dessert = 3 ...

2022: Week 8 - Pokémon Evolution Stats

Image
Challenge by: Will Sutton In this week's Preppin' Data we're collaborating with #GamesNightViz on their latest challenge Power Ups . We'll be diving into the Pokédex to explore how Pokémon combat stats change when they evolve. Inputs pkmn_stats  pkmn_evolutions  Requirements Import the data (excel file) From pkmn_stats dataset remove the columns height, weight and evolves from Pivot (wide to long) pkmn stats so that hp, attack, defense, special_attack, special_defense, and speed become a column called 'combat_factors' Using the evolutions data look up the combat_factors for each Pokémon at each stage, making sure that the combat_factors match across the row, i.e. we should be able to see the hp for Bulbasaur, Ivysaur and Venusaur on one row Remove any columns for 'pokedex_number' and 'gen_introduced' that were from joins at Stage 2 & 3 If a Pokémon doesn't evolve remove it from the dataset Find the combat power values relating to the Po...

2022: Week 7 - Call Center Agent Metrics

Image
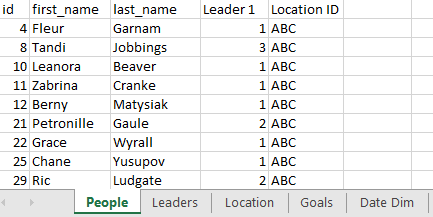
Challenge by: Kate Brown This week we have another incredible challenge created by Tableau Social Ambassador Kate Brown : For this week’s challenge we need to create a data set for our call center agent metrics. We have 2 Excel files that contain the monthly metrics for the agent and another file that contains the agent, leader, location, and goals.  If you work with databases you may encounter situations were you have one table that has ids and another table(s) that have the descriptors for those ids. We aren’t connecting to a database in this example, however, think about the people, location, leader, and date inputs in that way. Inputs People Data: People  Leaders  Location  Goals  Date Dim  Metric Data 2021: Jan - Dec Requirements Input the data People, Location, Leader, and Dates: Join the People, Location, and Leader data sets together Remove the location id fields, the secondary leader id field Create last name, first name fields for the agent and th...

2022: Week 6 - 7 letter Scrabble Words

Image
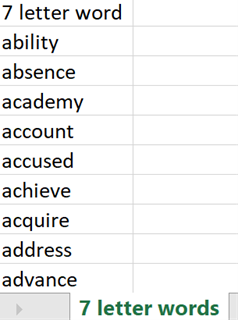
Challenge by: Jenny Martin For this challenge, we're going to take a look at 7 letter words which could be potentially high scoring in Scrabble and work out the likelihood of drawing the tiles needed to create this word. Are we going to make our lives easier by assuming that each tile drawn is an independent event and that the order tiles are drawn is irrelevant? Yes, but equally, if you have the statistical brain to calculate the probabilities as dependent events, considering all the possible orderings then we'd love to see that solution!  Inputs 7 letter words  Scrabble Scores  Scaffold (which you may or may not need!)  Requirements Input the data Parse out the information in the Scrabble Scores Input so that there are 3 fields: Tile Frequency Points Calculate the % Chance of drawing a particular tile and round to 2 decimal places Frequency / Total number of tiles Split each of the 7 letter words into individual letters and count the number of occurrences of each l...

2021: Week 50 - Departmental December - Sales

Image
Challenge By: Jenny Martin Uh-oh, looks like the Sales Team at AllChains have gone rouge with their trackers again. They can't even maintain consistency month to month! And what's the idea with having the Salesperson names at the end of each month?  This challenge was inspired by a dataset my colleague Ollie  encountered, except that dataset didn't have a RowID. If you think of a way to solve this challenge without a RowID we'd love to hear about it! Inputs October Tracker: November Tracker: Requirements Input the data Fill in the Salesperson names for each row (the name appears at the bottom of each monthly grouping) hint Bring out the YTD information from the October tracker and use it to create YTD totals for November too Reshape the data so all the bike types are in a single column Output the data Output 5 fields Salesperson Date Bike Type Sales YTD Total 915 rows (916 including headers) You can download the  full output here .  After you finish the challenge mak...

2021: Week 47 - Games Night Viz Collab

Image
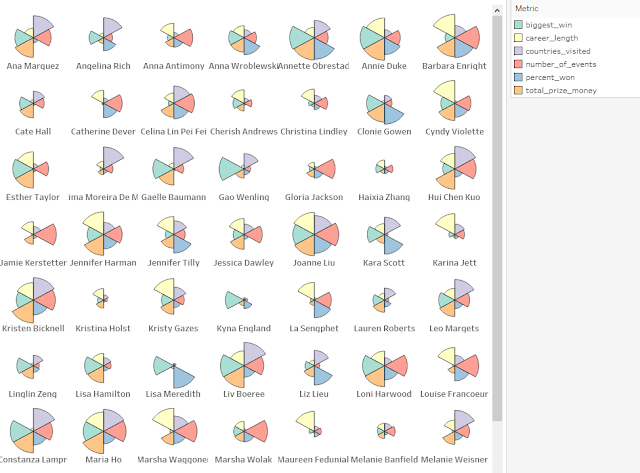
 Challenge By: Will Sutton Did you see the launch of #GamesNightViz a couple of weeks ago? It's a new community project which gives you the opportunity to practise your data visualisation, design and preparation skills. So we've decided to team up this week to bring you a #GamesNightViz style Preppin' challenge!  This week's challenge is about building new dimensions from #GamesNightViz's Top Female Poker Players data to better understand their successes across their poker careers. They've earned millions of dollars but was it all in one go? How many years have they been playing poker? How regularly do they win?  The resulting dataset will allow you to build a pizza plot/coxcomb chart like below, which you're welcome to do as a bonus challenge too! Inputs Top 100 Female Poker Players  Top 100 Poker Events  Requirements Input the Data Add the player names to their poker events Create a column to count when the player finished 1st in an event Replace any nul...

2021: Week 40 - Animal Adoptions

Image
 Challenge By: Jenny Martin I'm sure if we took a poll, there would be a large number of us who have become pet owners in the past couple of years. I myself have become the owner of a little kitten called Pyrrha.  It got me wanting to play with some pet data and I came across Austin Animal Center. They claim  over 90% of animals entering the center, are adopted, transferred to rescue or returned to their owners, which is impressive and a statistic we can validate for ourselves! Input Feel free to grab your own up to date data from the link above, or use this extract that we have downloaded: Requirements Input the data Remove the duplicated date field Filter to only cats and dogs (the other animals have too small a data sample) Group up the Outcome Type field into 2 groups: Adopted, Returned to Owner or Transferred Other Calculate the % of Total for each Outcome Type Grouping and for each Animal Type Output the data Output 3 fields Animal Type Adopted, Returned to Owner o...

2021: Week 39 - Painting Bikes

Image
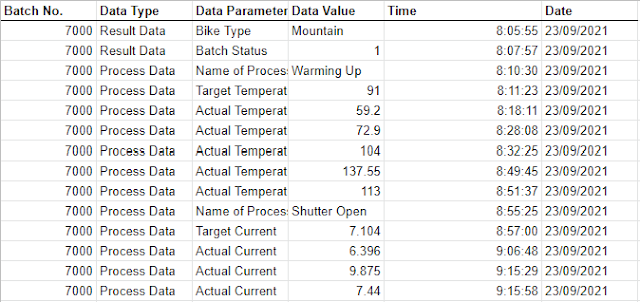
Challenge by Tom Prowse.  This week we make a return to our Bike store but this time we are looking at the painting process within the factory. The factory has a process where different bikes go through a process to be painted and the engineers are provided with some indicator values as the process progresses. It is vital that the engineers are able to track these indicators so they can keep an eye on whether the process is hitting it's target or there are any potential problems.  The data is currently provided in a bit of an unfriendly way with all of the parameters being in a single column. Data is also only provided when a value changes, therefore we should assume that the process value is the same as the previous value until it is updated later in the process. In order to get some value from the data set we need to change the structure and do some cleaning before we can visualise this with Tableau Desktop.  From the data set the engineers would like to have some infor...

2021: Week 34 - Excelling with lookups

Image
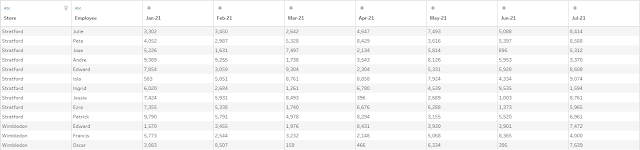
 Challenge By: Jenny Martin As we come to the end of our excel challenges month, it seems only right to think about vlookups and index matches. In Excel, these are great functions for bringing together data from different worksheets without having to manually copy and paste.  Our scenario this week is looking at Employee Sales at Allchains for each month of the year so far and we want to compare this to their Monthly Targets, stored on another sheet. Inputs We have 2 inputs this week: Employee Sales Employee Targets Requirements Input data Calculate the Average Monthly Sales for each employee In the Targets sheet the Store Name needs cleaning up Filter the data so that only employees who are below 90% of their target on average remain For these employees, we also want to know the % of months that they met/exceeded their target Output the data Output 5 fields Store Employee Avg monthly Sales % of months target met Monthly Target 4 rows (5 including headers) After you finish the...

2021: Week 29 - PD x WOW - Tokyo 2020 Calendar

Image
Challenge by Tom Prowse with collaboration with the Workout Wednesday team! This week is time for our annual get together with Workout Wednesday for a joint challenge so that you can have a full data prep to visualisation solution.  Unfortunately the Olympics was postponed in 2020, so for last year's collaboration we looked at historical winners through the history of the games. However, this year, Japan 2020 is going ahead so we thought it would be the perfect time to create an event calendar to help us keep track of the events that we don't want to miss.  Inputs The data comes from the Olympics website . ( Note; this was taken on Wednesday 14th July so the schedule for some events may have changed since! ). You can download the data here .  1. Event Schedule A list of all the event dates, times and locations throughout the games 2. Venue Details A list of all of the different venue locations Requirements Input the Data   Create a correctly formatted DateTime fiel...