Posts

Showing posts from July, 2022

2022: Week 30 C&BSCo Actual Sales Values

Image
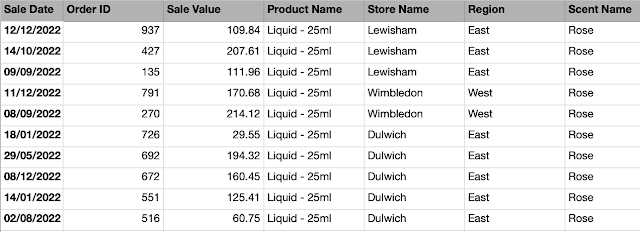
 Created by: Carl Allchin Welcome to the final week of beginners' month in July.  Chin & Beard Suds Co (C&BSCo) have been recording the percentage contribution of the top 3 sales people in each of their stores. They want to know how much value this actually equates to. This week's challenge will let you experience one final technique we haven't used this month yet, Unions.  Here's more support with Unions if you are new to them: How to Union in Prep Union theory Input There are four files you will need to input this week.  There are two inputs for Sales Data in each of our Regions (East and West). They are the same structure of data fields: The third file is a Store ID lookup table: The fourth file is same as the original input for Week 27: Requirements Input the 'Top 3 Sales People per Store' for both regions: East & West Combine these files Bonus challenge for experienced Preppers - take the Region Name from the File Name. For newer Preppers, use

2022: Week 29 - Solution

Image
Solution by Tom Prowse and you can download the workflow here .  The next instalment of our introductory month contained another key technique that is fundamental to data prep - Joins. The challenge we want to combine our targets data with our original data source so that we can expand our analysis. Let's see how to solve it! Step 1 - Sales Input The first step is to input both of the data sets into the workflow. Once we have connected to the Sales table, we want to extract the product type from the Product Name field. To do this we can use a custom split on the '-' to split the first value from it: We can then rename this field to Product Type.  After extracting the product type, we want to aggregate our table so we can see the total sales for each Product Type, Store Name, and Region combination: At this stage we have prepared all we need to you and our table should look like this: Step 2 - Targets Input We now want to turn our attention to the targets input. Currently, w

2022: Week 29 C&BSco Meeting Targets?

Image
 Challenge by: Carl Allchin  This week's challenge is a continuation of another introductory month for newer Preppers.  When you work with data, you are likely to increasingly ask more and more questions as you find out new insights. These additional questions often means you need to combine data sets together. This uses a technique called Joins. For this week's challenge, you might want to use the supporting links if you haven't joined data sets together before.  If you are newer to preparing data then you might want to use the following links to learn these techniques: Pivot Joins String calculations Input Two files : 1. The same input as Week 27 & 28 2. Targets (k's) Requirements Input both data sets Remove unnecessary values from the Product Name field to just leave the Product Type Total Sales for each Store and Product Type Change the Targets data set into three columns Product Store Sales Target (k's) Multiple the Sales Target (k's) by 1000 to create

2022: Week 28 - Solution

Image
Solution by Tom Prowse and you can download the workflow here .  This week we continued our fundamental challenges by focussing on a common problem in data preparation. That problem involves including data about something that doesn't happen. Our example is we're trying to identify the days when there were no sales at our stores. Let's see how we solved the challenge. Step 1 - Days with no sales First up we want to convert our date field from a datetime to just a date. This can be done by pressing on the calendar and clock icon in the top left of the field in the profile pane, and then changing to a Date option. We can now go and add some new rows for days when there were no sales. For this use the 'New Rows' step to help us. After bringing the New Rows into our workflow, we need to set this up so that we are creating a new row from our minimum to maximum sale date:  This will allow us to fill in the missing days and will create a new row for each of them. Our table

2022: Week 28 C&BSCo - No sales today

Image
Created by: Carl Allchin One of the hardest challenges with data preparation is recording something that doesn't happen. There are some neat tricks and techniques to do exactly this so here's your chance to practice.  Chin & Beard Suds Co. (C&BSCo) is trying to find how many days none of their stores actually sold any products. Thankfully for C&BSCo there aren't too many but the management team want to know which day of the week the non-sales days most commonly happen on.  If you are newer to data preparation, you might find the following links helpful: New Rows Working with Date data types Input The same input file as last week: Requirements Input the file ( download here ) Convert any data types required (nb. certain Steps in Prep Builder can only utilise limited data types) Create a new row for each day that doesn't have a sale Remove any date record where a sale occurred  Create a column for Day of the Week For each day of the week, count the numbers of

2022: Week 27 - Solution

Image
Solution by Tom Prowse and you can download the workflow here . This week was the first of our basic & intermediate challenges throughout July & August. The challenge is aimed at anyone just starting out and covers some of the fundamentals that you'll need to get started. Let's see how we can solve the challenge. Step 1 -  Separate Product Name First we need to connect to our data source and bring the single table into our workflow. Once we have the data, we can go about splitting the Product Name field into two separate fields (Product Type & Quantity). The Product Name contains a common structure of Product Type - Quantity, therefore we can use a Custom Split on the '-' to separate either side into different fields:  As a result of the split we now have 2 additional fields that we can rename to be Product Type and Quantity. The table should look like this:  Step 2 - Liquid & Bar Path We can now split our workflow into two separate path/branches. To do

2022: Week 27 - C&BSCo Clean and Aggregate

Image
 Created by: Carl Allchin Each January the Preppin' crew like to offer you the chance to learn the fundamentals. This year we are going further by using July and August to not just learn the basics but also learn the intermediate skill level data prep skills too. Some of these skills maybe familiar to you but hopefully the practice will make data prep perfections.  If you haven't taken part in one of these challenges before we offer up a weekly challenge set on a Wednesday. A solution post will be published the following Tuesday with a written and video solution. To take on the challenge, download the data, follow the requirements and check your output against our own. We will tell you field names and row counts to provide a quick overview. The order of the data fields and rows does not matter unless stated in the requirements.  All the challenges for the next two months will focus on Chin & Beard Suds Co (C&BSCo) a soap retailer that struggles with data cleanliness.  T

2022: Week 26 - Solution

Image
Solution by Tom Prowse and you can download the workflow here . The challenge this week comes from Algirdas Grajauskas who has provided us with his Spotify data so we can tidy it up and then analyse it. Step 1 - Minutes Played Our first task is to create a new field that breaks down the milliseconds into minutes. To do this we can use the following calculation:  Mins Played   ROUND( [ms_played] / (1000*60) ,2) Multiplying by 60 allows us to convert into minutes, with a decimal based on the seconds. Note, after the decimal doesn't show how many seconds. This will need to be converted again if we need to calculate this. After this our table should look like this:  Step 2 - Extract Year Next we need to extract the year from the timestamp field. We can use the inbuilt functionality within Tableau Prep for this. First we want to duplicate the timestamp field and rename it to Year, then press on the menu (three dots) icon to go to Convert Dates -> Year Number. Step 3 - Rank Artists No