Posts

Showing posts with the label Data Interpreter

2022: Week 21 - Multi-sheets of Madness
Image
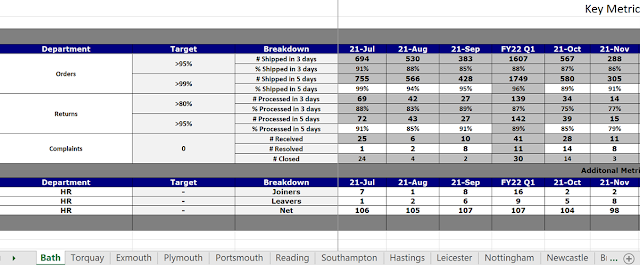
 Challenge by: Jenny Martin We're returning to Chin & Beard Suds Co for this week's challenge. It's inspired by a real data structure, which needed some cleaning before connecting to Tableau Desktop.  Inputs There are 12 sheets from different shops reporting the Key Metrics that we are interested in. There are Additional Metrics in a table below that are not of interest to us for this challenge.  Requirements Connect to the data Bring together the Key Metrics tables from each Shop You'll notice that we have fields which report the quarter in addition to the monthly values. We only wish to keep the monthly values Reshape the data so that we have a Date field For Orders and Returns, we are only interested in reporting % values, whilst for Complaints we are only interested in the # Received We wish to update the Breakdown field to include the Department to make the Measure Name easier to interpret We wish to have a field for each of the measures rather than a row per m...
2020: Week 43

Image
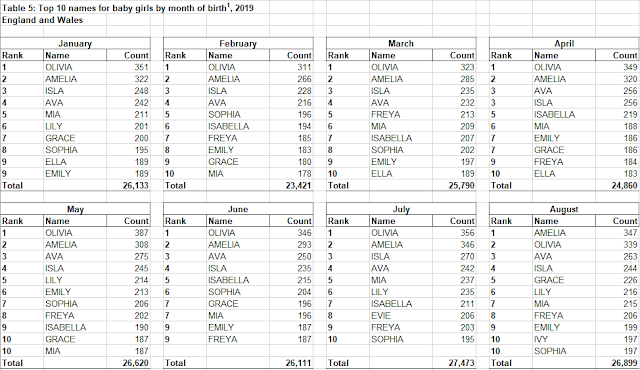
Challenge by: Jenny Martin Sometimes when researching one Preppin' Data idea, you encounter a rather hideous data structure that makes you wonder, "could Prep handle this?" Suddenly you're on a completely different tangent to the challenge you were originally planning and you've got a chunky Prep workflow that just begs to be turned into a challenge itself. So here we are, looking at the most popular baby names for boys and girls in England and Wales in 2019.  Inputs The data itself comes from the Office for National Statistics : Download inputs There is one input for boys names and one input for girls names. As you can see, each month is its own table and they are laid out next to each other in the Excel sheet. Not an ideal input for Tableau Desktop! Pay particular attention to May and August which have additional rows as there have been ties in the rankings.  Requirements Input the data I recommend starting with the boys names Remove totals Pivot to create a mon...

2020: Week 35

Image
Challenge by: Jenny Martin This week we're looking at a slightly odd way that Chin & Beard Suds Co have been structuring their store sales and target data:   As you can see, for each Store, there are 3 rows, the first being the Sales values, the second row containing the Target values for each month and the third row containing the difference between these values. It's your job to transform this monstrosity  unique table into a more conventional output that we could use in Tableau Desktop.  Inputs You have 2 options this week: Start the challenge with a Row ID already present (as pictured above) Use this as an opportunity to play with the Script step and create your own Row ID! Our solution will cover the RServe option, but you're welcome to use TabPy instead. For help getting set up with RServe, check out this blog For TabPy, check out this blog by our colleague Brian Scally   Requirements Input the data Make sure Store names have filled down correctly and remo...

2020: Week 27

Image
Week 27 by Tom Prowse For this week's challenge we are planning a staycation here in the UK, and what better to do than go on a surfing trip! We have identified the area of South Devon, UK as a great surfing area and used the Surf-Forecast website to help us gather some information about each of the surfing sites.   The four of us here at Preppin Data all have a range of skills and requirements for our trip, so can you select the best place for each of us to go? Input 1 Input, 3 Sheets: Information Data from the Surf-Forecast website (and some of our own made-up data!) Location Data about each location, including the best season for surfing Preppers Data about each of our requirements and skill levels Requirements Input Data Find a way to join all three tables together Identify which locations would be suitable for each person Watch out for any duplicated person & site combinations Rank the top sites in terms of rating for each person. If there is a tie, then use the reli...

2020: Week 18

Image
Due to the social distancing and isolation caused by Covid-19, all football games have been postponed across the majority of the world. Therefore to help fill the void, this week’s challenge is all about analysing football team line-ups and in-particular the Premier League games for Liverpool. We start with a nicely formatted spreadsheet that includes the following: Match Details - Including dates, teams, location and formation Match Day Squad - 18 players broken down into Starting XI & Substitutes Starting XI - the 11 players who started the game for Liverpool Substitutes - the 7 players who started as a substitute for Liverpool Substitution Information - Includes the Player On/Off and the Time From this we want to answer some questions about the playing time of each of the players. Requirements Input Data Update the headers for Match Details, Starting XI, Substitutes. Ideally this will be done without just renaming each individual header separately. Note, for su...

2019: Week 26

Image
This week's challenge is to NOT USE TYPED CALCULATIONS in Prep to solve the challenge. No cheating with copying and pasting formulas either - just use Prep Builder's functionality. Last night, we went to have a burger at a local restuarant (hi Brickfields in Brockley !!) and I noticed their cocktail menu looked ripe for a data prep challenge. What I wanted to understand is the cost of the ingredient linked to the price of the cocktail? Requirements  Input the data file Name the columns 'Cocktails', 'Ingredient' and 'Price respectively  Seperate the ingredients and create a single column of them Work out the position of the ingredients within the list of ingredients in each cocktail Work out the 'average price of the cocktails that ingredient is used in' Add the original cocktail price back in Output the file Output 5 Columns 53 Rows (54 including headers) For comparison,  here's our output files .  Don't to ...

2019: Week 2 Solution

Image
No hints this week in the background image I’m afraid! We also need to lead with a quick apology to those of you caught out by the fact we didn’t initially specify that one of the requirements was a bit of a nightmare if you hadn’t updated Tableau Prep to at least version 2019.1.  Once again, we saw a range of varying solutions to this challenge – all legitimate and correct – but there were 3 main features we were hoping to give some exposure in order to assist you in the future! You can find our solution here (seen below) which uses these features and can read on for further details about each one. Our Clean steps could all be done in the Union step, however spreading them out makes the flow more manageable in the future. The Data Interpreter The data interpreter is so easily overlooked yet is so useful. It can detect things like titles, notes, footers, empty cells, and so on and bypass them to identify the actual fields and values in your data set....