2019: Week 1
Welcome to your first Preppin' Data challenge.
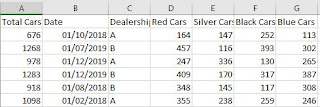
This week, Jonathan and I would like you to look at taking a simple Excel file on Car Sales and complete the following requirements:
This week, Jonathan and I would like you to look at taking a simple Excel file on Car Sales and complete the following requirements:

- Import the starter file (click to open the Google Drive link)
- Make a date that will work in Tableau Desktop
- Work out the total car sales per month / per car dealership
- Retain the car sales per colour columns
- Export the file
Due to the way Tableau Prep works, your output:
- Might not have the same row or column order as our output
- Will have the same number of columns (7)
- Will have the same number of rows (48)
For comparison, here's our output file.
For bonus points - you can build a visual analysis of this mocked up data set.


