2019: Week 2 Solution
No hints this week in the background image I’m afraid! We also need to lead with a quick apology to those of you caught out by the fact we didn’t initially specify that one of the requirements was a bit of a nightmare if you hadn’t updated Tableau Prep to at least version 2019.1.
Once again, we saw a range of varying solutions to this challenge – all legitimate and correct – but there were 3 main features we were hoping to give some exposure in order to assist you in the future!
You can find our solution here (seen below) which uses these features and can read on for further details about each one.
 |
| Our Clean steps could all be done in the Union step, however spreading them out makes the flow more manageable in the future. |
The Data Interpreter
The data interpreter is so easily overlooked yet is so useful. It can detect things like titles, notes, footers, empty cells, and so on and bypass them to identify the actual fields and values in your data set.
In the case of this challenge, using Data Interpreter on your sheet quickly cleans up those pesky headers. However, there’s another feature of Data Interpreter that we also think could have been a big help in this challenge.
NOTE: A few people may have got hold of an earlier input file called "Preppin Data - Week 2" opposed to simply "Week 2 Input". The below lines do not apply if you have the former file as an input as it seems that the Data Interpreter is smart enough to combine the two tables into one without even telling you!?
A few people noted that in their first Clean step that they noticed a weird value called “City” in their [City] field, and duly excluded this value. This is fine, but did you notice that Data Interpreter also picked up on this and provided two new sheets?
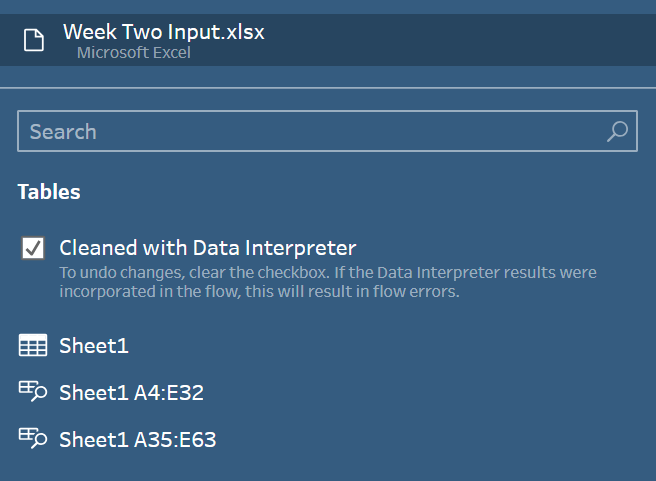
Data Interpreter recognises when there’s two separate tables in a single sheet (as was the case in our challenge), cleans both tables up, and offers these to you in the left pane. A quick glance at both of these reveals all the columns have the same headers, so a quick solution is to add them both into your workflow and union them together!
Group & Replace
Group & Replace is neat little way of catching and fixing potential spelling errors in your data (or in our case purposefully butchered spellings). By choosing one or more group & replace options, Tableau Prep groups and renames data values based on certain criteria. The option can be found when clicking the three little “More options” dots next to a field.

There are four group and replace options:
- Manual Selection: it leaves it to you to decide what values you think should be grouped together.
- Pronunciation: it finds and group values that sound alike. What?! Magic I say. This option isn’t flawless but is still pretty cool.
- Common Characters: it finds and groups values that share the same common letters. For this option it reduces each value to a collection of its unique letters (so London becomes “dlno”) and groups values with the same collection (so “London” gets grouped with “Lodnon”, “noDonl”, and even “Lllllllloooondddoooon” as they are all made of combinations of "dlno").
- Spelling: it finds and groups text values that are spelled alike. It uses a complicated algorithm to determine how alike words are spelt, but I’ve found it to be pretty accurate!
You can play around with which option or options you use to fix a field with typos, but for our challenge I found the Spelling option to most effective. Any values that get missed by one grouping option can either be manually grouped afterwards or can be gathered up by running a second Group & Replace option!
However, as a word of warning for this: always sanity check the results. This is because you could find some erroneous grouping. For example, suppose you have data with a variety of cities, and four of those cities happened to be:
- Aartukka (Finland)
- Karatkau (Georgia)
- Katakura (Japan)
- Takakura (Japan)
All these cities are anagrams of each other, so there’s a good change one or more of the Group & replace options would accidentally group these together!
Row-To-Column Pivoting
Yes, as of version 2019.1 (hence some confusion) Tableau Prep now includes the fabled Cross-Tab/Row-to-Column Pivot! This isn’t immediately obvious as the symbol for the Pivot step still shows the Column-to-Row icon as default, however if you add a pivot step you can now see this selector for how which direction you’d like to perform your pivot.

If you:
- create a calculated field which combines your [Metric] & [Measure] values into a single [Metric – Measure] string field,
- delete your old [Metric] & [Measure] fields,
- then add a Column-to-Row pivot which pivots on your new field and aggregates the [Value] field,
you should find you now have all your metrics in separate columns as required!


