2019: Week 3
This week's inspiration comes from Bethany Lyons, a Tableau Product Manager. Bethany's sessions at the conference are phenomenal each year and always tackle some pretty chunky issues. Her session at the Tableau Conference in 2017 was on how to handle data on subscriptions. If you've never come across this challenge (lucky you) then you are about to experience why this is an issue.
Scenario:
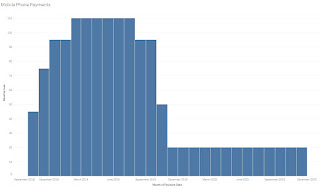
You work for a mobile / cell phone company. You boss asks you to pull together the revenue report of your current batch of contracts (sadly there are only four contracts!). They need to know how much revenue is generated each month from these contracts whilst they are 'live' (ie from their start date until 'x' months in the future when the contract runs out).
The aim of the week is to be able to create a chart like this but with all the data prep work done in Tableau Prep Builder. If you think that is simple - here's the input data:

Requirements for this week:
- Import the file
- Make sure you use both sheets
- Use one sheet to help you create a row of data for each month the person's contract is 'live' for
- Remove unnecessary fields of data
- Output for use within Tableau Desktop
- Recreate the viz

Your output file should:
- Have five columns
- Have fifty-five rows of data (including the headers)
- Be at the person, per month level of detail
- Have no cells without a value
- Save as a .tde or .hyper file (csv if you are not going to build the view in Tableau Desktop)
For comparison, here's our output file. Don't to forget to fill in our participation tracker!


