2019: Week 6 Solution
Welcome back to the solution for week 6 of Preppin’ Data. Firstly, Carl and I would like to thank everyone for the free labour you have all given in helping run the Chin & Beard Suds Co business. It was much cheaper than finding and hiring an external data analyst.
In terms of actually completing this challenge there were 3 main elements:
So let’s dive in.
This will generate the profits gained within each city. (No need to consider profits lost – C&BS Co is always in profit due to being such a great idea and marketed so well. And also due to the free labour.)
In order to aggregate the data to find the total profit during March in England for each product type, we can add an aggregation step where we group by:
and sum by [Profit]. This will create two rows with the total profit for each type of soap during March in England. If you’ve calculated or added the month in by this point, then including the [Month] in your aggregation means it will be kept in your aggregation output on each row.

1. Pull "England – Mar 2019" into the view.
2. Change the input settings from Single table to Wildcard Union. This is so we can get the table name as a field later on.
3. Change the Sheets Matching Pattern to “England - *”. This will make sure this input doesn’t try and read the product details or company info sheets.
4. Click Apply. You’ll see two new fields appear: [Table Names] and [File Paths], and you should also notice a "+" symbol appear on the input icon which signifies a Wildcard Union input.

5. In a Clean Step, you can now use the following calculation to make a date out of the [Table Names] field.
DATE(
DATEPARSE(
"dd MMM yy",
"19" + SPLIT([Table Names], "-", 2)
)
)
Note: If putting functions inside other functions I like to spread them over multiple lines to make it easy to track where each function starts and ends.
What this is doing is using the SPLIT() function to split the [Table Names] field on “-“ and taking everything after the “-“, i.e. “ Mar 19”. It then prefixes it with a “19” (as we know the C&BS Co month starts on the 19th to create “19 Mar 19”. It then uses the DATEPARSE() function to convert this into an actual DateTime! Finally I wrapped this inside a DATE() function to convert from DateTime to Date as we don’t need the hours, minutes, and seconds, however you could just convert the field after making it using the profile pane too.
In terms of actually completing this challenge there were 3 main elements:
- Joining the "Soap Pricing Details" with the "England - Mar 2019" data.
- Calculating the profit and aggregating it to the country and soap type level.
- Unioning the newly aggregated data to the "Company Data" table.
- At any point before, during, or after the previous elements, adding the date information for the new data.
You can view our solution below and download it here.
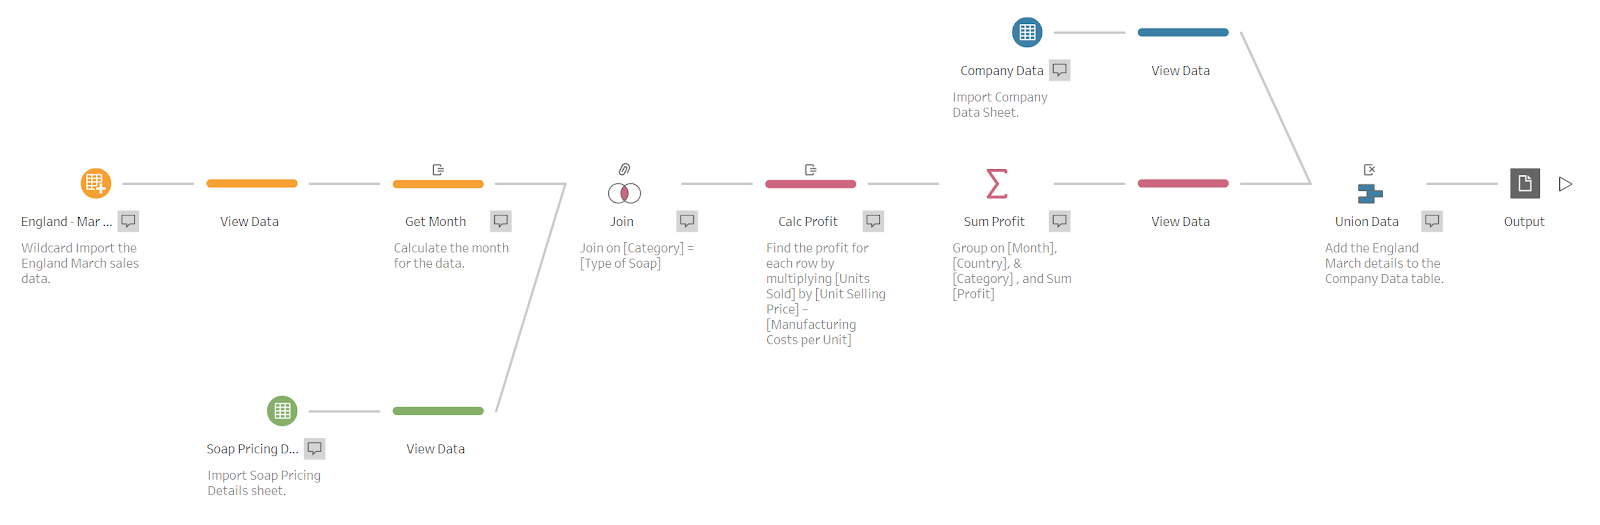 |
| The full solution workflow. |
So let’s dive in.
Joining the soap product information with the city sales data.
No hidden tricks here, simply joining the product details table to the city sales data on [Category] = [Type of Soap] is enough to get the desired result.Calculating the profit and aggregating it.
After joining "Soap Pricing Details" with "England - Mar 2019", calculating the profit can be done in a single formula:
[Units Sold] * ([Unit Selling Price] – [Manufacturing Costs per Unit])
This will generate the profits gained within each city. (No need to consider profits lost – C&BS Co is always in profit due to being such a great idea and marketed so well. And also due to the free labour.)
In order to aggregate the data to find the total profit during March in England for each product type, we can add an aggregation step where we group by:
- [Country],
- [Category],
- [Month] (if calculated by this point),
and sum by [Profit]. This will create two rows with the total profit for each type of soap during March in England. If you’ve calculated or added the month in by this point, then including the [Month] in your aggregation means it will be kept in your aggregation output on each row.
Union the data
Now that we have the total profit for each type of soap we need to add it to the "Company Data" so that we can track overall monthly performance across our regions. There are two main things to take into account during this union.If you haven’t added the month field by this point then the new data will be given a NULL [Month] value in the final table.
There’s a few options for fixing this including:- Option 1: A calculated field to replace the original [Month] field.
- Option 2: Right-click on “null”, select Edit Value, and type in “19/03/2019”.
 |
- Option 3: Hold CTRL & left-click on “null” and “19/03/2019”, right click on the "19/03/2019" value, and click Group.

If you didn’t name your aggregated field as “Profit”, e.g. “Sum Profit”, then Tableau Prep will not automatically combine these into a single field.
Other than going back and renaming the aggregated field, the quickest way to resolve this is to hold CTRL, select both profit fields, and then select the Merge option which will combine both fields together.
Adding in the date field for the new data.
There are a ton of ways to manually add the correct date for the "England – Mar 2019" data. Most of these involve manually entering in the date at one stage or another. Instead, I’d like to highlight a way of dynamically getting the date so that you can re-use this flow in future months.1. Pull "England – Mar 2019" into the view.
2. Change the input settings from Single table to Wildcard Union. This is so we can get the table name as a field later on.
3. Change the Sheets Matching Pattern to “England - *”. This will make sure this input doesn’t try and read the product details or company info sheets.
4. Click Apply. You’ll see two new fields appear: [Table Names] and [File Paths], and you should also notice a "+" symbol appear on the input icon which signifies a Wildcard Union input.

DATE(
DATEPARSE(
"dd MMM yy",
"19" + SPLIT([Table Names], "-", 2)
)
)
Note: If putting functions inside other functions I like to spread them over multiple lines to make it easy to track where each function starts and ends.
What this is doing is using the SPLIT() function to split the [Table Names] field on “-“ and taking everything after the “-“, i.e. “ Mar 19”. It then prefixes it with a “19” (as we know the C&BS Co month starts on the 19th to create “19 Mar 19”. It then uses the DATEPARSE() function to convert this into an actual DateTime! Finally I wrapped this inside a DATE() function to convert from DateTime to Date as we don’t need the hours, minutes, and seconds, however you could just convert the field after making it using the profile pane too.


