2019: Week 12
In previous weeks of Preppin' Data we have seen the struggles of manual data capture and the impact particular on text based data. In our experience, it's not just text where the impact is felt by manually inputting data, but the accuracy of capturing all types of data.
This week, we position ourselves in the shoes of IT at Chin & Beard Suds Co. The company has had a number of system outages but we need to understand the size of the issue.
*this is probably quite a challenging week*
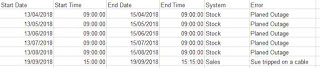
Luckily for us, we have two separate data sources: 1. a set of automatically formed logs that captures service down time with a precise timestamp; 2. a manual spreadsheet where staff can capture issues they are having with systems. Sadly, for the latter data source, the data is captured without the same accuracy as the automatic logs. With the automatic logs, have we got all the data though? Help us clean the data and make clear how much downtime we are suffering from, in which system and what error causes the biggest % of downtime.
Requirements

Output

For comparison, here's our output file. Don't to forget to fill in our participation tracker!
This week, we position ourselves in the shoes of IT at Chin & Beard Suds Co. The company has had a number of system outages but we need to understand the size of the issue.
*this is probably quite a challenging week*
Luckily for us, we have two separate data sources: 1. a set of automatically formed logs that captures service down time with a precise timestamp; 2. a manual spreadsheet where staff can capture issues they are having with systems. Sadly, for the latter data source, the data is captured without the same accuracy as the automatic logs. With the automatic logs, have we got all the data though? Help us clean the data and make clear how much downtime we are suffering from, in which system and what error causes the biggest % of downtime.
Requirements

Auto input
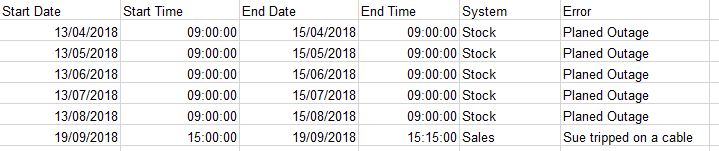
Manual input
- Input the data
- Make the manual date and time a date / time field
- Bring the datasets together in a manner that removes the duplicate records from the manually captured data set
- Duplicates are determined by a system being down at the same time but recorded both automatically and manually. The automatic data should always overwrite the manual data.
- Workout the duration (in seconds) of the error
- Understand the '% of downtime' per system in hours
Output

- 8 columns
- 11 rows (12 including headers)
- No nulls
For comparison, here's our output file. Don't to forget to fill in our participation tracker!


