2019: Week 13 Solution
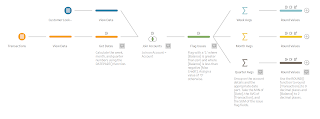
The full solution workflow can be viewed below and downloaded here.
There are four main learning outcomes of this week’s Preppin Data:
1. Using the DATEPART() function.
2. Flagging issues and counting the frequency of these issues.
3. Using different levels of aggregation on the same data set.
4. Using the ROUND() function.
There’s also a neat little bonus learning objective to save yourself some time when repeating common process snippets.
5. Saving time by copying and pasting workflow changes and tools.
Using the DATEPART() function
In order to get the week, month, and quarter numbers for our data we can use the aforementioned DATEPART() function. This function takes two parameters:
DATEPART(‘name of the date part you want’, [the Date Field you want the date part for])
In our case this means we can use the following function calls to get the numbers we desire:
- DATEPART(‘week’, [Date])
- DATEPART(‘month’, [Date])
- DATEPART(‘quarter’, [Date])
You can find a full list of the possible datepart names here.
Flagging and counting issues
As mentioned in previous challenges a common data prep task is to flag and track issues. In this case of this challenge we want to flag and count how many days each company has gone overdrawn and how many days each company has exceeded their maximum credit allowance.
In order to assign these two flags to each row of data we can use the following two formulae:
[Balance Below Zero?]
|
[Max Credit Exceeded?]
|
IF [Balance] >= 0
THEN 0
ELSE 1
END
|
IF [Balance] >= -[Max Credit]
THEN 0
ELSE 1
END
|
The first formula simple checks if the [Balance] has dropped
below zero, whereas the second formula checks whether the [Balance] has dropped
below –[Max Credit]; we use negative [Max Credit] here as [Max Credit] is how
far below zero the company’s [Balance] is permitted to drop to.
We use 0 and 1 here instead of TRUE & FALSE as this
means that later on when aggregating we can take the SUM of [Balance Below
Zero?] and SUM of [Max Credit Exceeded?] to count how many days the issue
occurred in.
Using different levels of aggregation in the same dataset
As mentioned in the initial challenge, sometimes the correct level to aggregate to isn’t so clear and learning how to modify your aggregations to create different views is great for both exploring the data and satisfying stakeholders.
In the case of this challenge there are 3 fields we need to group by and 5 whole fields we need to aggregate on.
Grouped Fields:
- [Account]
- [Name]
- [DatePart]
So we want each row of data to be for each company in each [DatePart] ([Week], [Month], or [Quarter]).
Aggregated Fields:
- MIN: [Date]
- We want the date for the start of each [DatePart]. When used with dates, MIN & MAX take the earliest and most recent dates respectively.
- AVG: [Transaction]
- AVG: [Balance]
- For the above two fields we simply want the average for that company and date part.
- SUM: [Balance Below Zero?]
- SUM: [Max Credit Exceeded?]
- As mentioned earlier, we can count all the flags in each of these fields by summing them up to count the number of days each issue occurs
Using the ROUND() function
The ROUND() function does what is says on the tin and can be used to round any decimal number to a given number of decimal places. It takes two parameters:
ROUND([Numerical Field], ‘integer’)
It will round the given numerical field to the number of decimal places defined by the ‘integer’ provided. In our case, these functions look like this:
[Monthly Avg Transactions]
|
[Max Credit Exceeded?]
|
ROUND([Transaction], 0)
|
ROUND([Balance], 2)
|
You can actually provide a negative integer too: -1 will round to the nearest 10, -2 to the nearest 100, -3 to the nearest 1000 and so on.
Saving time by copying and pasting workflow changes and tools
You may have noticed that this week there were a bunch of very similar tools and changes. You can actually copy and paste these to re-use them!
Re-using changes
Consider the two calculated fields we made earlier: [Balance Below Zero?] and [Max Credit Exceeded?]. The creation of these functions show up as Changes in the left-hand side of the profile pane.
 |
| The Changes pane. |
Rather than re-typing the function each time, or copying and pasting the code within the function, you can right-click on the change for the first function and then right-click on the Changes pane and paste it back in. You can then open this change and tweak as required by clicking on the new change and selecting the pencil icon (or right-clicking on the change and selecting ‘Edit’).
You can copy and move changes between tools too.
Re-using tools
After calculating the aggregated view for one of our dateparts and then performing the rounding steps we need to repeat all these steps and changes for the other two dateparts. Or do we? We can re-use these tools by:
1. Selecting the tools we want to copy.
2. Right-clicking and selecting ‘Copy’.
3. Right-clicking on the canvas and selecting ‘Paste’.
4. Connecting the parent tool to the pasted tools by dragging the parent tool to the left of the pasted tools so that the ‘Add’ option appears and releasing.
 |
| Demonstrating re-using tools. |
You can then open the tools and tweak the changes or fields as required. In our case this means changing the aggregations for the correct dateparts and then updating the field names.


