2019: Week 17
This week’s challenge comes courtesy of Jenny Martin from DS14 of The Data School and her experience in writing a dissertation on how to rig elections different voting systems:
We’ve had a lot of votes in recent years and I’m sure everyone’s just about had enough by now. Naively, I used to believe that the process you use to determine the “winner” of a vote was irrelevant, surely they’re all roughly the same?
Then I got to university and discovered this depressing theorem:
I thought it would be fun to prove this disconcerting truth in Tableau Prep with some common voting systems! There are 3 I would like you all to consider
1. First Past the Post (the one we currently use in the UK)
In order to demonstrate the seriousness of the situation, our votes relate to preferences in chocolate:
Don't to forget to fill in our participation tracker!
We’ve had a lot of votes in recent years and I’m sure everyone’s just about had enough by now. Naively, I used to believe that the process you use to determine the “winner” of a vote was irrelevant, surely they’re all roughly the same?
Then I got to university and discovered this depressing theorem:
Arrows Impossibility Theorem
For elections with 3 or more candidates, there is no voting system that satisfies the following conditions:
·
Not a dictatorship
·
If everyone ranks A above B, the population should rank A above B
·
If C withdraws from the election, the ranking of A and B should not
change.
|
I thought it would be fun to prove this disconcerting truth in Tableau Prep with some common voting systems! There are 3 I would like you all to consider
1. First Past the Post (the one we currently use in the UK)
- Everyone picks their favourite candidate.
- The most commonly picked candidate wins.
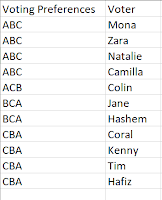
- Everyone ranks the candidates in order of preference.
- If the candidate mostly commonly ranked first is ranked first in more than 50% of the votes, they win.
- If this is not the case, then the candidate least commonly ranked first is deleted from all the votes and there is a recount.
- This process of counting and deleting continues until a candidate holds over 50% of the popular vote.
- Everyone ranks the candidates in order of preference.
- The better the rank, the more points the candidate receives.
- E.g. if there are 3 candidates, the candidate ranked first gets 3 points and the candidate ranked last gets 1 point.
- The candidate with the most points wins.
 |
| All the votes. |
- A = Aero
- B = Bounty
- C = Crunchie
Requirements
- Download the data.
- Calculate the winner if we used a FPTP voting system.
- Calculate the winner if we used a AV voting system.
- Calculate the winner if we used a Borda voting system.
Notes:
- This week we're expecting to see lots of different methods so please do share them with us on Twitter using the #PreppinData hashtag!
- You should always count votes and points using the tools in Prep, but to filter down to just the winner you can just sort the fields and manually filter the data.
- Bonus Points: design a flow that dynamically filters down to the winner in each voting system. It's a good exercise but our solution won't cover it.
- As there's no way (that I know of, prove me wrong) to program loops in Tableau Prep, to discover the AV winner you’ll need to repeat the vote count and candidate deletion steps until a candidate meets the >50% of the vote requirement.
Output
 |
| The required output. |
- One output file.
- 2 columns: [Voting System], [Winner].
- 3 rows – one for each voting system.
------------------------- SPOILERS BELOW -------------------------
Hints
- The FPTP winner should have 5 votes.
- The AV winner should have 6 votes in the end.
- The Borda winner should have 23 points.
- You’ll need at least one aggregation in each system, but in Borda you’ll also want a pivot step too.


