2019: Week 29 Solution
You can view our full solution workflow below and download it here!
Some of the customers are subscribed to multiple packages, which is logged as “1|2|3” for example. We firstly need to split this up using a custom split on every ‘|’. We then need to pivot all the new [Package – Split X] fields into a single field using a Column-to-Rows pivot. This single field contains many blank [Package Split] values, as not every customer had multiple subscriptions, so we need to remove all these. This can be done by right-clicking on the blank value in the profile pane and clicking ‘Exclude’.
Using this field we can now annualise the prices using the pricing data and the following calculation:
After obtaining these values, we can calculate the [Mystery Price] by dividing the total annual subscription cost by the total packages per year. Since I’m always looking out for the customer, we’re also going to wrap this calculation in a FLOOR() function, to round down to the nearest whole integer.
This means our data now has a field called [Mystery Price] which is null for every row that isn’t the ‘Mystery’ package. In order to replace all old unknown pricing data, we first update the [Price] field using the following IF-ELSE statement:
Afterwards, we can then also update the [Subscription Cost (Per Annum)] by repeating the same calculation as before, [Price] * [Packages per Year], as the [Price] field now contains the Mystery price.
No actual aggregation required.
We need to sum up the subscription costs for each name as some customers have more than 1 row of data as they are subscribed to more than one package.
 |
| Our final solution workflow. |
1. Split & Pivot the [Packages] from the customer data.
Some of the customers are subscribed to multiple packages, which is logged as “1|2|3” for example. We firstly need to split this up using a custom split on every ‘|’. We then need to pivot all the new [Package – Split X] fields into a single field using a Column-to-Rows pivot. This single field contains many blank [Package Split] values, as not every customer had multiple subscriptions, so we need to remove all these. This can be done by right-clicking on the blank value in the profile pane and clicking ‘Exclude’.
 |
| Excluding the empty values after pivoting. |
2. Join the subscription pricing and frequency info.
From here we can bring in all the extra data. Bring in the pricing data by using an inner join on [Package] (customers) = [Subscription Package] (pricing) and then the package data using an inner join on [Frequency] (customers) = [Subscription Package] (frequency). Remember to remove the extra unnecessary fields afterwards as an inner join (currently) always results in data duplication. |
| Joining the pricing data. |
3. Calculate the packages per year and annual costs for each row.
In order to calculate the price for the Mystery package, we first need to annualize all the known package prices and frequencies. We can first get the packages per year using the frequency information from the frequency data and the following CASE statement:|
[Packages per Year]
|
|
CASE [Frequency
Period]
WHEN 'week' THEN 52
WHEN 'month' THEN 12
WHEN 'quarter' THEN 4
WHEN 'year' THEN 1
END
|
Using this field we can now annualise the prices using the pricing data and the following calculation:
|
[Subscription Cost
(Per Annum)]
|
|
[Price] * [Packages
per Year]
|
4. Aggregate to find the price of the Mystery Package
We can now work towards finding out how much the Mystery package should actually cost. The first step in this is using an aggregation step to sum up both the annual costs and the number of packages per year – we don’t need to group on anything as we’re just summing across the whole data set. The important thing here is to remember to first filter out the ‘Mystery’ package data; we’re using the rest of the data to help us develop this.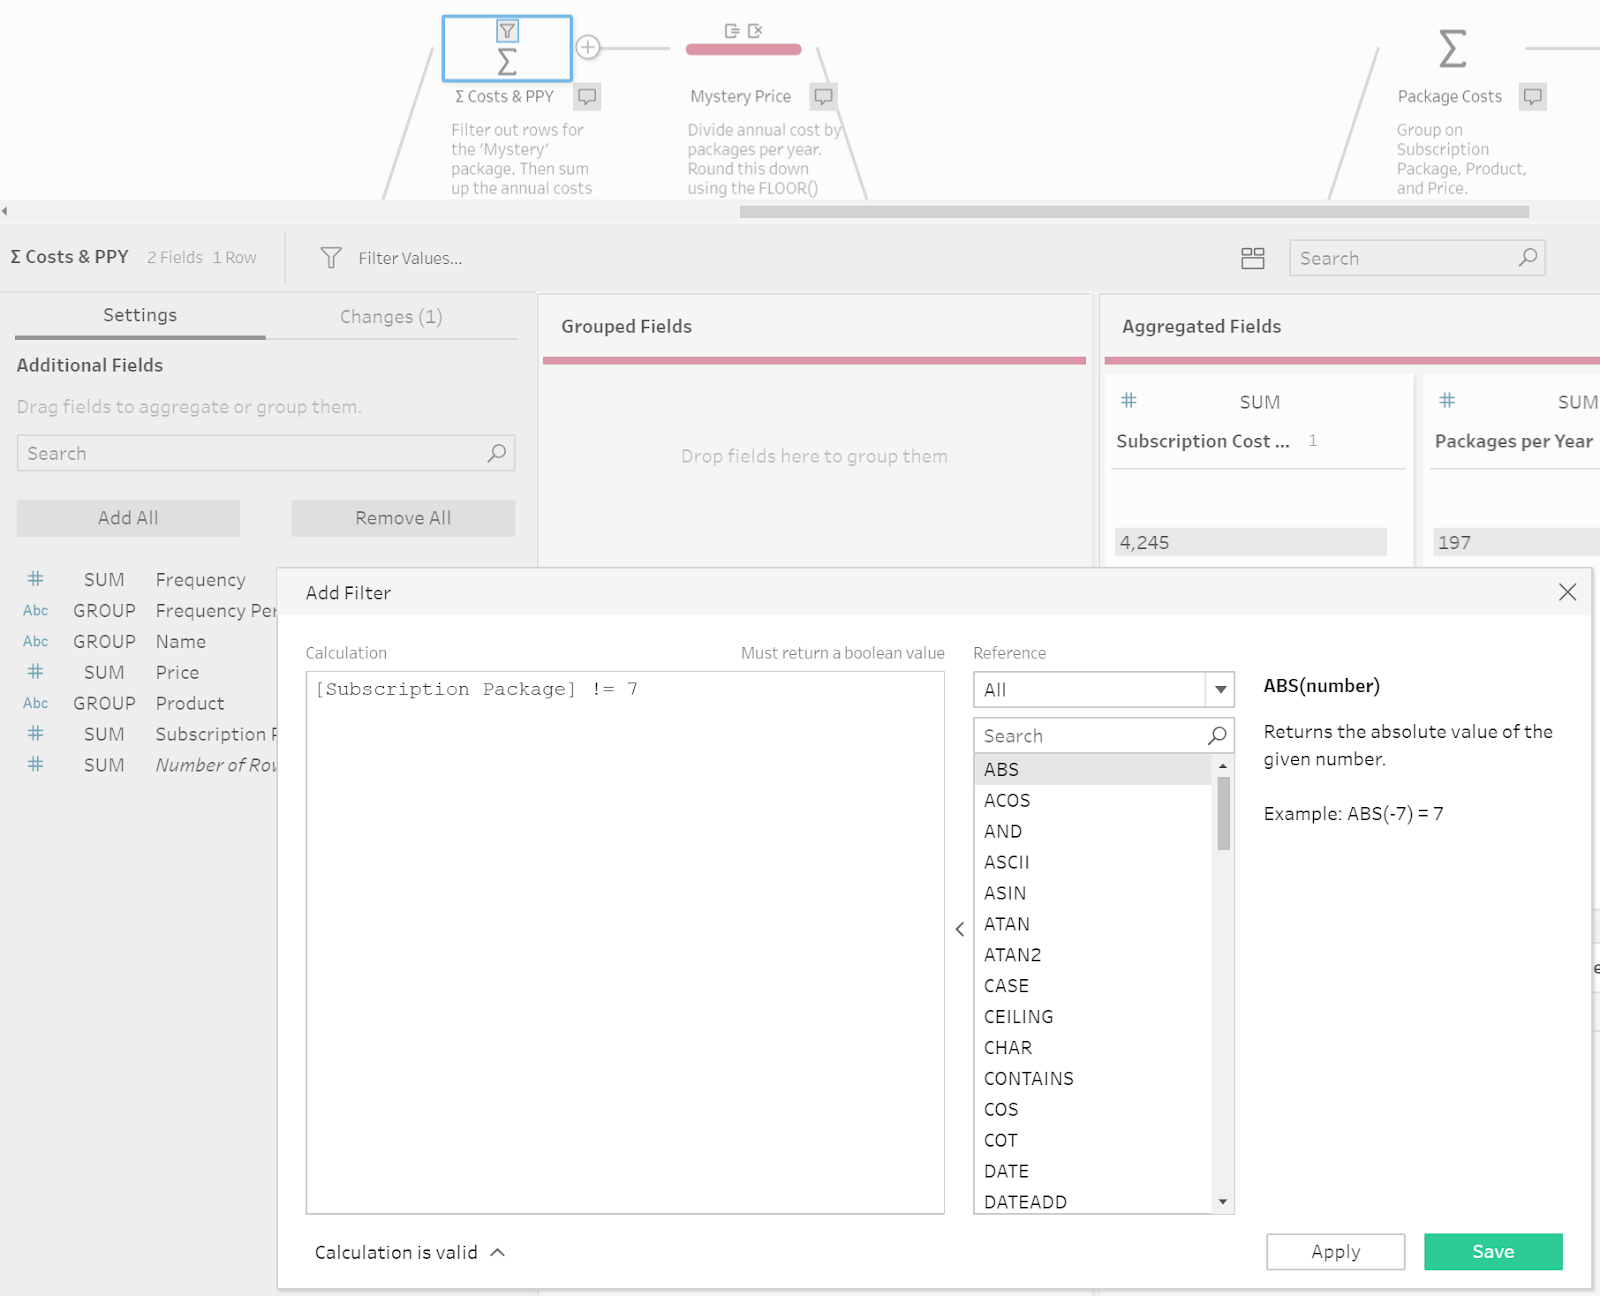 |
| Filtering Mystery rows and aggregating values. |
After obtaining these values, we can calculate the [Mystery Price] by dividing the total annual subscription cost by the total packages per year. Since I’m always looking out for the customer, we’re also going to wrap this calculation in a FLOOR() function, to round down to the nearest whole integer.
5. Replace the unknown Mystery price with the calculated Mystery price.
There’s a couple of ways to join this data back into our full data set. Our preference was to create a calculated field next to our calculated price called [Product] which just contained the value “Mystery”, and then use a right-outer join, on [Product] = [Product], back to the data before we started aggregating it. |
| Joining the Mystery price back into the data. |
This means our data now has a field called [Mystery Price] which is null for every row that isn’t the ‘Mystery’ package. In order to replace all old unknown pricing data, we first update the [Price] field using the following IF-ELSE statement:
|
[Price]
|
|
IF [Product] =
"Mystery"
THEN [Mystery Price]
ELSE [Price]
END
|
Afterwards, we can then also update the [Subscription Cost (Per Annum)] by repeating the same calculation as before, [Price] * [Packages per Year], as the [Price] field now contains the Mystery price.
6. Aggregate to create our final outputs.
Finally, all that’s left is to aggregate in two different branches in order to achieve the final desired output.Subscription Price Table
Firstly, we can create our new subscription pricing table. This can be made with an aggregation step that:- Groups on Subscription Package;
- Groups on Product;
- Groups on Price.
No actual aggregation required.
Annual Cost to Customer
Secondly, we can create our customer annual cost table by using an aggregation step with these settings:- Groups on Name;
- Sums up Subscription Cost (Per Annum).
We need to sum up the subscription costs for each name as some customers have more than 1 row of data as they are subscribed to more than one package.
 |
| The final aggregations. |


