2019: Week 33 Solution
You can view our full solution workflow below and download it here!
Quite a lengthy challenge this week which always means there’s many different paths for the same solution. In explaining our solution, I’ll mark clearly where the flow forks for each of the two outputs.
Replace the values for any null end dates to “01/10/2019”.
where A is the top pay band and C is the bottom pay band. This is important for later on when we’re joining the salary band & bonus information in.
Click on the RegEx to see it broken down on RegEx101. Finally, make the following replacements on the [Range] field and update it to [Salary Band]:
We treat our employees well, so no one get’s labeled as “Underpaid”, but we included it for good measure just in case.
The solution now forks between output 1 and output 2. Continue reading for output 1 and skip ahead one section to pick up with output 2.
Now just add an Output step to the end and you’re done.
To get around this, we can use the DATEPARSE() function to tell Tableau Prep the actual format of our dates:
With a correctly formatted [Month] field we can now use the DATETRUNC() field to pull out the start date for each quarter:
Now we can finally sum up our sales to see if each store met their quarterly targets for each quarter. Add an ‘Aggregate’ step and group on [Quarter], [Store], and [Quarterly Target]. We also need to make the following two aggregations:
Summing up the sales is an obvious requirement; however we also need the maximum (most recent) month in each quarter as the criteria for earning a bonus for a quarter is that the employee must have worked for at least the first day of the last month in each quarter.
We’re not ready to join the sales data to the rest of our prepared data. We want to join on three conditions:
Condition 2 is important as employees only get a bonus if they worked at some point during the last month of the quarter and condition 3 is important as we need to make sure the employee started before the quarter finished. Without condition 3, an employee could start during Q2 but still get a bonus for Q1.
This function is saying that if the store didn’t hit their sales target, or the employee themselves is being paid way too much, then we take away their bonus. If they don’t meet their criteria we leave their bonus as is.
This gives us what percentage of each employee’s salary is their bonus equivalent too. We multiply it by 100 here so we can read it as a percentage, however if we wanted to do any further analysis, in Tableau Desktop for example, it could be worth leaving it as a value between 0 & 1.
After this, simply add an Output step and you’re done!
 |
| Out full solution workflow. |
1. Use a wildcard union to import all the employees.
Drag one of the store employee files onto the canvas and change the input option from ‘Single Table’ to ‘Wildcard Union’. Set the sheets ‘Matching Pattern’ to “* Store” and click ‘Apply’. This will bring in and union the other store employee data. Finally, untick ‘File Paths’ in the fields to keep and rename ‘Table Names’ to ‘Store’ as it lets us know which store each employee comes from.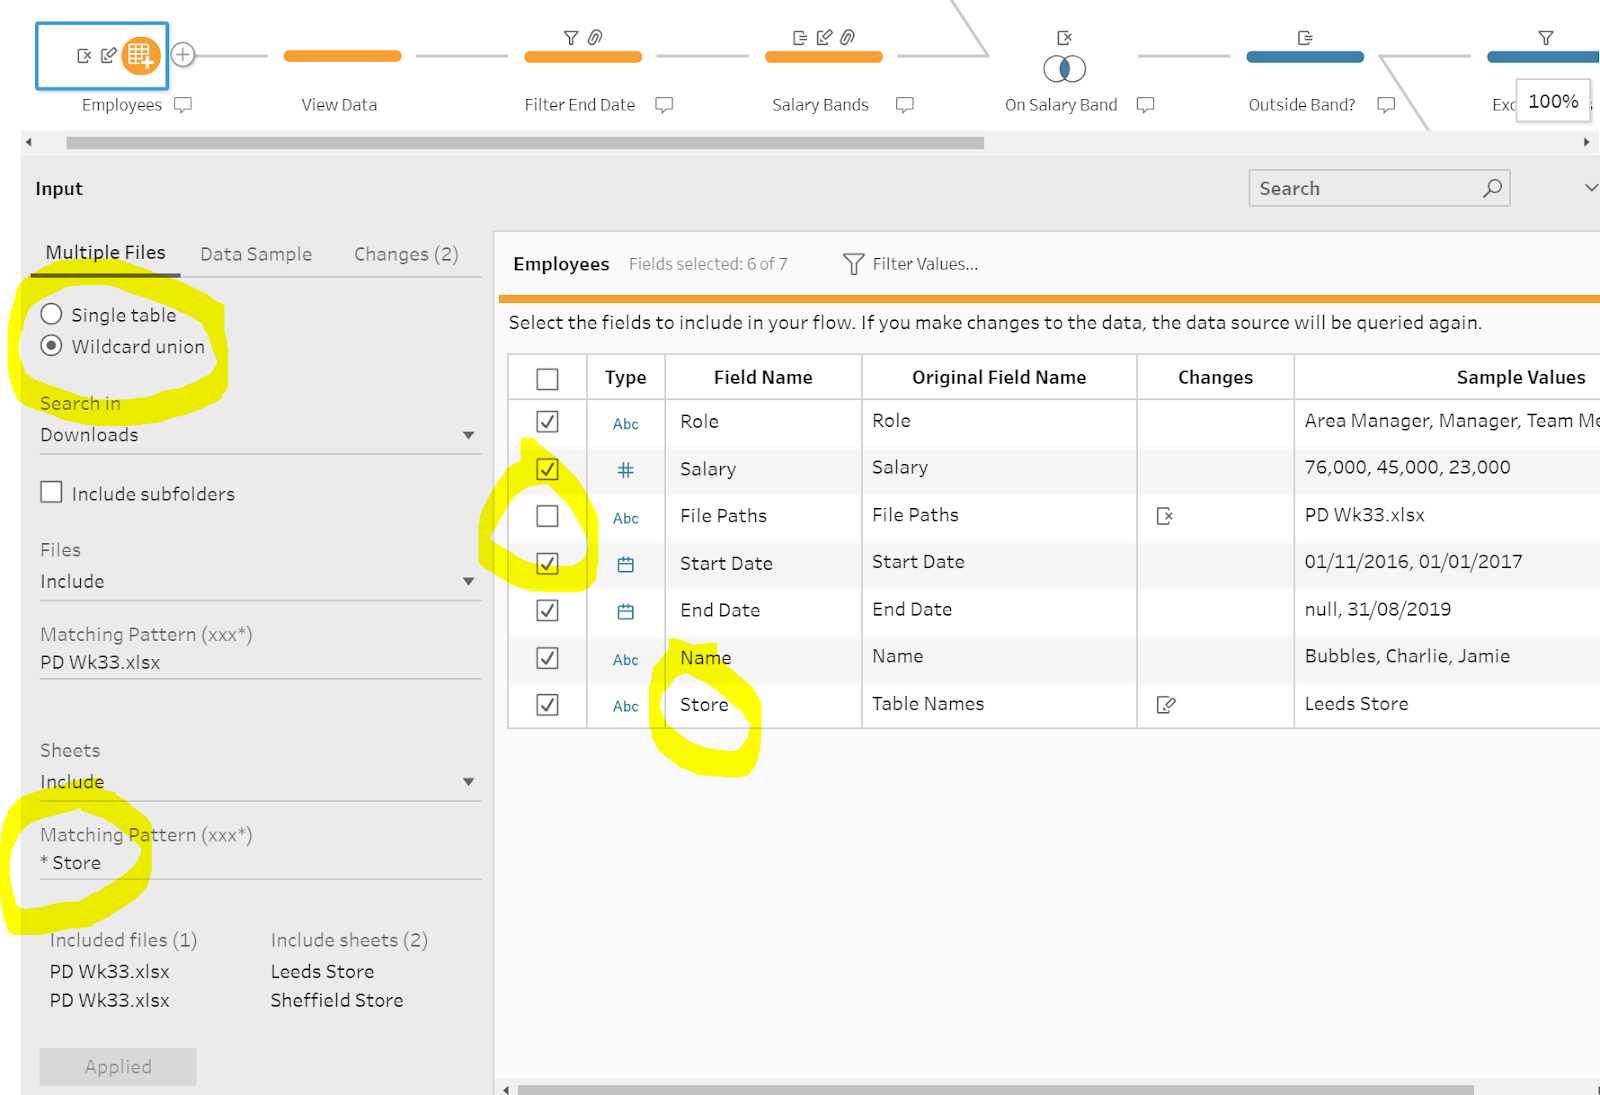 |
| Wildcard union settings. |
2. Filter out non-2019 employees.
On the [End Date] field, select ‘Filter’ and choose ‘Range of Dates’. Choose ‘Minimum’, set the minimum value to “01/01/2019” and tick ‘Include null values’. This will ensure we only keep employees who either left in 2019 or are current employees (as of the 1st October 2019). |
| Filtering to keep only 2019 employees. |
3. Assign salary bands based on role.
We assume that the ‘Area Manager’ gets paid the most, and the ‘Team Member’ gets paid the least. In solution, we assign these roles salary band codes by duplicating the [Role] field and making the following substitutions:- Area Manager => A,
- Manager => B,
- Team Member => C,
where A is the top pay band and C is the bottom pay band. This is important for later on when we’re joining the salary band & bonus information in.
 |
| Assigning salary bands by duplicating and replacing values. |
4. Prep the Salary Range data for joining to the employee data.
Firstly, we need to split the [Range] field into [Salary Range Start] and [Salary Range Finish] so we can determine later on if each employee is getting overpaid and convert these new fields, and the [Bonus amount], to integers. Unfortunately, the £ symbols aren’t so easy to remove. We believe an efficient method to achieve the desired result is as follows.- Use the ‘Remove Punctuation’ option to remove the commas and dashes from [Range] & [Bonus amount].
- Then, use the following RegEx to extract the desired numbers and convert them straight to integers.
[Salary
Band Start]
|
[Salary
Band Finish]
|
[Bonus
amount]
|
INT(
REGEXP_EXTRACT(
[Range]
, '(\d+)'
)
)
|
INT(
REGEXP_EXTRACT(
[Range]
, '(\d+)$'
)
)
|
INT(
REGEXP_EXTRACT(
[Bonus amount]
, '(\d+)'
)
)
|
Click on the RegEx to see it broken down on RegEx101. Finally, make the following replacements on the [Range] field and update it to [Salary Band]:
- £40000£70000 => A,
- £30000£40000 => B,
- £15000£30000 => C.
 |
| The join settings, |
5. Join the Salary Range data to the Employee data.
After the above prep has been completed, we can now join the employee & salary range data together on [Salary Band] = [Salary Band]. We can just use an inner-join here and should have no unmatched fields.6. Label employees whose salary does not match their salary band.
We now need to check if any employees are being overpaid according to their role’s salary band, or whether any employees are being paid more than even the maximum salary in the whole company. To do this, we can use an IF-ELSE calculation like the one below to find and label their employees.
[Salary
Status]
|
IF
[Salary] > 70000
THEN "Outside Range"
ELSEIF
[Salary] < [Salary Band Start]
THEN "Underpaid"
ELSEIF
[Salary] > [Salary Band End]
THEN "Overpaid"
ELSE
"Within Band"
END
|
We treat our employees well, so no one get’s labeled as “Underpaid”, but we included it for good measure just in case.
The solution now forks between output 1 and output 2. Continue reading for output 1 and skip ahead one section to pick up with output 2.
OUTPUT 1: Overpaid Employees
7. Exclude employees whose salary matches their salary band.
All that’s left is to filter out any employee with a salary that lies within their salary band. The quickest way to do this is to simply right-click on the “Within Band” value in the [Salary Status] field and click ‘Exclude’. |
| Excluding employees with an appropriate salary. |
OUTPUT 2: Bonus Analysis
7. Import the sales data and pivot the date fields.
With the employee and salary range data prepped, we now need to prep the store sales data as well to determine what bonuses our employees have received, if any. The first thing we need to do is pivot all the date fields, each containing the sales for that month, into two fields:- [Month],
- [Sales].
 |
| Pivoting sales data. |
8. Parse the date and get the quarter.
All of our sales targets are at the quarter level so we need a field that tells us which quarter each month is in. To do this, we first need to convert the [Month] field to an actual date. Unfortunately, the dates are in UK format whilst Prep by default works with American date formats. If we simply change the data type on the field it thinks all the months are actually days in January. |
| What happens if you convert the field type to date without any processing. |
[Month]
|
DATEPARSE("dd/MM/yy",
[Month])
|
With a correctly formatted [Month] field we can now use the DATETRUNC() field to pull out the start date for each quarter:
[Quarter]
|
DATETRUNC('quarter',
[Month])
|
9. Aggregate the sales and months at the quarter & store level.
Now we can finally sum up our sales to see if each store met their quarterly targets for each quarter. Add an ‘Aggregate’ step and group on [Quarter], [Store], and [Quarterly Target]. We also need to make the following two aggregations:- SUM up the [Sales] field & rename as [Quarter Sales],
- Take the MAX of the [Month] field & rename as [Last Month in Quarter].
Summing up the sales is an obvious requirement; however we also need the maximum (most recent) month in each quarter as the criteria for earning a bonus for a quarter is that the employee must have worked for at least the first day of the last month in each quarter.
 |
| Aggregating the monthly sales and finding the last month in each quarter. |
10. Prep the Store Sales data to be joined to the Employee data.
Before we go ahead and join our sales data to the employee data, we need to quickly update the [Store] field using [Store] + “ Store” as the employee [Store] field ends in “ Store” whilst the [Store] field in the sales data does not.11. Join the sales data to the employee data.
 |
| The join settings. |
- Employee Side | Sales Side
- Store = Store.
- End Date >= Last Month in Quarter.
- Start Date <= Last Month in Quarter.
Condition 2 is important as employees only get a bonus if they worked at some point during the last month of the quarter and condition 3 is important as we need to make sure the employee started before the quarter finished. Without condition 3, an employee could start during Q2 but still get a bonus for Q1.
12. Assign bonus amounts depending on targets.
For each employee and each quarter they worked, we now need to determine if they are going to receive a bonus based on the [Quarter Sales] and [Quarterly Target]. We can update the [Bonus amount] field to reflect this using the following calculation:
[Bonus
amount]
|
IF
(
[Quarter Sales] < [Quarterly Target]
OR
[Salary Status] = "Outside
Range"
)
THEN 0
ELSE
[Bonus amount]
END
|
This function is saying that if the store didn’t hit their sales target, or the employee themselves is being paid way too much, then we take away their bonus. If they don’t meet their criteria we leave their bonus as is.
13. Aggregate the bonus amount for each employee.
We can now sum up the total in bonuses that each eligible employee has earned. To do this, add a new aggregation step that:- GROUPS on:
- [Name],
- [Salary],
- [Store].
- SUMs up the [Bonus amount].
14. Finally, calculate bonus as a percentage of employee salary.
We now need one last calculated field to get out desired output.
[%
Bonus of Salary]
|
(
[Bonus amount] / [Salary] ) * 100
|
This gives us what percentage of each employee’s salary is their bonus equivalent too. We multiply it by 100 here so we can read it as a percentage, however if we wanted to do any further analysis, in Tableau Desktop for example, it could be worth leaving it as a value between 0 & 1.
After this, simply add an Output step and you’re done!


