2019: Week 35 Solution
You can view our full solution workflow below and download it here!
 We now need to actually join these data sets together. We’ve used a full-outer join with the following conditions:
A) Was there enough stock ready on the request date?
B) When was the order actually fulfilled?
C) If the order was delayed, how delayed was it?
We can answer these questions with the following calculations:
And we’re done!
Here we should also remove some of the unnecessary fields, but take care to keep [Scent-1] and [Product-1] and rename them to [Scent] & [Product] respectively after deleting the old scent and product fields.
And we’re done!
 |
| Our full solution workflow. |
1. Use a Running Total to calculate the total stock in the warehouse to date.
Starting with out output from week 34, we first want to calculate the total stock in our warehouse for each [Product] and [Scent] on any given date. To do this, we first duplicate the data and then join it to itself on:- [Product] = [Product]
- [Scent] = [Scent]
- [Date] >= [Date]
- GROUP on:
- [Supplier]
- [Date]
- [Product]
- [Scent]
- [Quantity]
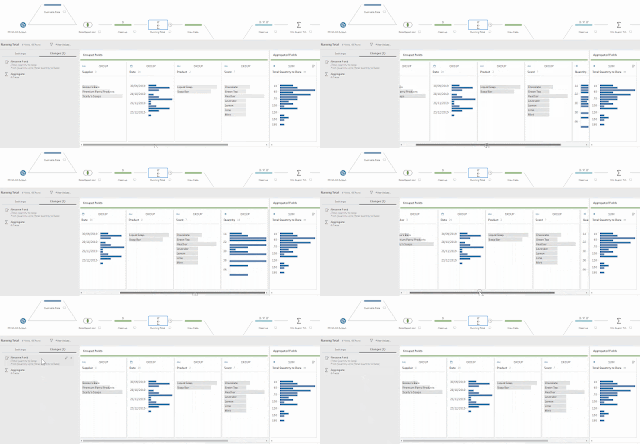
- SUM up [Quantity-1] and rename to [Total Quantity to Date].
 |
| Total stock in warehouse aggregation settings. |
2. Use a Running Total to calculate the total stock requested to date.
We now need to perform another running total on the store orders for each [Product] and [Scent]. We duplicate the data again and then this time join on:- [Product] = [Product]
- [Scent] = [Scent]
- [Date Required] >= [Date Required]
- GROUP on:
- [Store]
- [Product]
- [Scent]
- [Quantity Requested]
- [Date Required]
- SUM up [Quantity Requested-1] and rename to [Total Quantity Requested to Date].
Total stock requested aggregation settings.
3. Join the warehouse data & the request data together.
 We now need to actually join these data sets together. We’ve used a full-outer join with the following conditions:
- [Product] = [Product]
- [Scent] = [Scent]
- [Total Quantity Requested to Date] <= [Total Quantity to Date]
OUTPUT 1: Order statuses
4. Exclude any products that have never been ordered.
After the join we need to do some general clean-up. In particular, we need to filter any rows where the [Store] is NULL as this means that the [Product] and [Scent] in that row have never been requested. We can also remove some duplicated fields from the join and rename [Date] to [Restock Date] so it’s clear whether we’re looking at the [Date] of the request or the [Restock Date] in the warehouse for the given [Product] and [Scent]. |
| Excluding all null stores. |
5. Find the earliest date that each request could be fulfilled.
We now need to reduce the number of rows to just the earliest [Restock Date] for each request so we know if the request can be fulfilled in time. To do this we can use an aggregation step with the following conditions:- GROUP on:
- [Store]
- [Product]
- [Scent]
- [Supplier]
- [Quantity Requested]
- [Date Requested]
- Take the MIN of [Restock Date]
 |
| Earliest fulfillable date aggregation settings. |
6. Label which orders can’t be fulfilled on time.
Finally, we need to create some calculated fields to determine:A) Was there enough stock ready on the request date?
B) When was the order actually fulfilled?
C) If the order was delayed, how delayed was it?
We can answer these questions with the following calculations:
[Stock Ready?]
|
[Date Fulfilled]
|
[Days Request
Delayed]
|
[Date Required]
>= [Restock Date]
|
IF NOT [Stock
Ready?]
THEN [Restock Date]
ELSE [Date Required]
END
|
DATEDIFF('day',
[Date Required], [Date Fullfilled])
|
[Stock Ready?]
This simply returns TRUE if the date that the product is required is after the date that the product is actually available, and returns FALSE otherwise.[Date Fulfilled]
This uses our new [Stock Ready?] field. If the stock is ready in time, then the order can be fulfilled on the date it is required. If it’s not ready, then it gets fulfilled whenever the stock is available, i.e., the restock date.[Days Request Delayed]
This now uses our new [Date Fulfilled] field along with the DATEDIFF() function. This calculates the difference in days between the date the product was requested and the date the order was fulfilled. If there’s no difference it returns ‘0’, otherwise it lets us know how delayed the order was.And we’re done!
OUTPUT 2: Surplus Products
4. Keep only the products that have never been ordered.
Unlike out other output, this time we need to keep only the rows which don’t have a [Store]. The quickest way to do this is simply right-click on the ‘NULL’ value in the [Store] field and select ‘Keep Only’. |
| Keeping only null stores. |
Here we should also remove some of the unnecessary fields, but take care to keep [Scent-1] and [Product-1] and rename them to [Scent] & [Product] respectively after deleting the old scent and product fields.
5. Find the total surplus product for the unordered products.
Finally, we can use an aggregation step to find the total surplus we have for each of the unordered products with the following settings:- GROUP on:
- [Supplier]
- [Product]
- [Scent]
- Take the MAX of [Total Quantity to Date] and rename to [Surplus Product].
 |
| Total surplus product per unordered product aggregation settings. |
And we’re done!


