2019: Week 35
This week's challenge builds on our Supply Chain challenge of last week. Last we created a data set that enabled us to understand how our stock levels were going to recover from their zero position (that's right, we emptied our warehouse). This week we are looking at whether those recovering stock position is going to enable to meet the requests from of our stores of stock top-ups.


Using last week's output of stock levels and when they became available (also provided as an input sheet this week)...

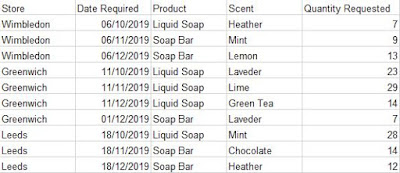
...we need to determine which of the Store's requests we can meet. The requests have been captured like this:

Requirements
- Input the data sets
- Form a running total of our stock levels for each product & scent.
- Form a running total of the requested quantities for each product & scent.
- Compare stock levels to determine:
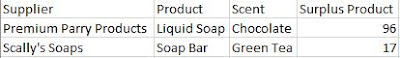
- Are any products held in stock not actually needed by any stores? If so, how much surplus stock do we have for these?
- Which store requests can be met on their requested date? If a request can’t be met in time, how long does the store have to wait?
Output
Output 1 - Surplus Products:
- 4 fields:
- Product
- Scent
- Supplier
- Surplus Amount
- 2 Rows (3 including headers)

- 9 Fields:
- Store
- Product
- Scent
- Supplier
- Quantity Requested
- Date Required
- Stock Ready?
- Date Fulfilled
- Days Request Delayed
- 19 Rows (20 including headers)
The output can be found here for comparison. Don't to forget to fill in our participation tracker and share your solutions with us using #PreppinData on Twitter!


