2019: Week 41
This week our customers here at Chin & Beard Suds Co are not happy. We have received a number of complaints about products which we have recently shipped. We’re always upset to have disappointed customers and we have recently implemented a new policy regarding complaints. If a customer is unhappy with a product, we will refund this item. However, if more than 20% of items shipped from one batch receive complaints, then we will recall the whole batch and therefore lose money on the entire batch.
We want to know how much money we’re going to lose from refunds alone, from recalling whole batches, and the total of money we have lost. We would also like to find out what our stock levels are looking like after dealing with all these complaints.
Unfortunately, these complaints have not been recorded in the best of ways. Each row of data contains an order number, customer number, item number and the complaint itself. We also have a table of all our orders and another containing the batches we recently ordered from our supplier.
Requirements:


Complaints
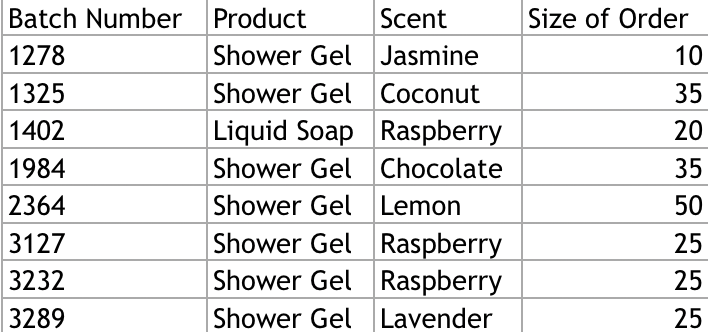
Batch

Orders
- Input all datasets
- Parse out the order number, customer number and item number from each complaint.
- Workout which orders have received a complaint
- Calculate how much money we have lost from refunds alone, recalling entire orders (20% of items of a product complained about and the loss is on the entire batch whether sold or not) and the total sum:
- Calculate the % of ordered items from a batch which have received a complaint.
- If this is above 20%, then we will class the whole batch as refunded and therefore lose out on money from all ordered items, and the remaining unordered stock.
- If the % of ordered items from a batch is less than 20%, then we will just refund the items which we have received complaints on.
- Work out how much stock we have remaining after all our orders, refunds and stock recalls.
- Output the data
Output
Two files:

- Refund totals
- Type of Refund
- Money Lost

- Stock remaining
- Product
- Scent
- Stock Remaining
The outputs can be found here for comparison. Don’t forget to fill the participation tracker and share your solutions using #PreppinData on Twitter.


