How to...do Analytical Calculations
When Tableau Prep was originally released, a number of functions that users of Tableau Desktop were used to, were not present within the tool. Part of a Tableau user's normal analytical process were not straight forward within Prep. Some of these capability are in the process of being added to the tool and here is how.
Table Calculations in Tableau Desktop are highly flexible, easy to use in a couple of clicks. Table Calculations allow the analyst to handle secondary aggregations like rank or running total, that would not be otherwise possible in Tableau.
The challenge with Table Calculations is the exactly the same thing that makes them great - the flexibility. A Table Calculation can be easily reconfigured to perform the calculation on whatever Dimensions are within the view. Therefore, whenever a user wants to use the calculation, they need to be able to understand how reconfigure the calculation. With complicated views this can impact both performance of the view and accuracy of the data shown if the technique isn't done correctly; thus the need to push this work in to the Data Preparation stage.
But Analytical Calculations within the Preparation stage can also add benefits to the Data Preparation stage. In previous posts and challenges, like 2019 Week 4, the analytical process can either begin or be completed in Prep Builder. Therefore, there is the need to have functions, like those found in Tableau Calculations in the Data Preparation phase.

Analytical Calculations have a syntax that is different to other functions found in Tableau Prep:
{ PARTITION [Dimension] : ORDERBY [Measure] : ANALYTICAL_CALC ( ) }
Let's explore each term:
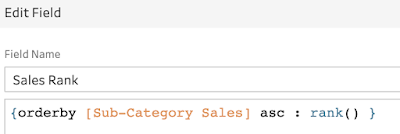
- Partition - like partitions in Table Calculations, this is how to restart an Analytical Calculation if required. For example, ranking each Sub-Categories Sales but restarting the rank for each Category.
- OrderBy - this is the order in which the Analytical Calculation will be processed.
- Analytical Calculation - currently the Analytical Calculations are:
- Rank ( ) - returns the standard competition rank (for each rank let's use an example value list 3, 7, 7, 10 - this would return 1, 2, 2, 4)
- Rank_Dense ( ) - returns the dense rank (1, 2, 2, 3)
- Rank_Modified ( ) - returns the modified competition rank (1, 3, 3, 4)
- Rank_Percentile ( ) - returns the percentile rank (25, 75, 75, 100)
- Row_Number ( ) - returns a row number
Now, with this understanding of how to form the Analytical Calculations, let's look at how to use them.
Rank
Rank is short for Ranking. Within Desktop, Rank is used for many purposes like understanding the best and worst performers in a dataset, as well as being used to set limits on datasets, ie the Top 100.
To simplify this example, let's look at Total Sales for each Sub-Category.

After the Sales Aggregation, let's rename the Sales value, Sub-Category Sales.

To be able to form a Rank calculation, let's specify how to Rank the values. In this case, by setting the ranking ordered by Sub-Category Sales, the values will be ranked from 1 upwards based on the size of the values from largest to smallest.

The result of the calculation is 1 through to 17 as there are 17 Sub-Category Sales values.

The default ordering of the calculation is from largest to smallest. The Rank can be reversed with the addition of ASC inside the ORDERBY section of the calculation.

Row Number
The Row Number function allows a value to be given to each row based on a direction specified in the orderby. The default order is Descending (largest to smallest, or latest to earliest).

This results in an incremental number for each row of data increasing as the Order Dates increase.

The Row Number can help to sort data to make it easier to analyse when doing more complicated cleaning tasks.
Use Cases
Top 'N' Filter
In earlier versions of Prep Builder, forming Top N filters was quite the challenge. To create rank involved a complicated self-join with challenging Join Conditions. Now, the Rank functionality allows a Top 'N' filter to be easily formed. Let's take the Rank formed earlier based on Sub-Category Sales and filter just the Top 5 Sub-Categories by Sales.

This results in just the Top 5 being returned.

Filter out half the data
Using a similar technique to above, you can set how much of a dataset you wish to return (based on a value in the data). This is a useful technique if the volume of data, in this case Sub-Categories, will increase over time but you still wish to return the same representative amount.

With the Rank formed, the values returned are between 0 (largest value in this case highest sales) and 1 (lowest). The Rank Percentile filter to bring back the highest 50% of Sub-Categories.

For the seventeen Sub-categories in the Superstore dataset, this will return nine sub-categories.

As more people get access to the latest versions of Prep Builder, more Use Cases will emerge.


