2021: Week 4
This is the last in the 'Starter Challenges' series to get you up and Preppin' to start the new year. We've enjoyed running this mini-series so much we're already looking at creating another similar series later in the year.
This week's challenge involves picking up some more of the fundamental skills and gives you some chances to practice some of the skills you've picked up over the last few weeks. As always, we'll be guiding you along the way with some useful help links if you need a couple of reminders or chance to explore those new techniques.
The new technique for you to learn this week is Joins. If you've worked with different data solutions for a number of years, you'll be familiar with Joins but if you are new you're in for a treat! Joins allow us to bring two data sources together. This allows for much easier, richer and deeper analysis as data is often in many different locations. Use the help links if this is a new technique for you. Joins are one of the harder concepts to pick up so make sure you've set aside a good amount of time to explore.
Challenge by: Carl Allchin
Input
Requirements
- Input the file
- Union the Stores data together (help)
- Remove any unnecessary data fields your Input step might create and rename the 'Table Names' as 'Store'
- Pivot the product columns (help)
- Split the 'Customer Type - Product' field to create: (help)
- Customer Type
- Product
- Also rename the Values column resulting from you pivot as 'Products Sold'
- Turn the date into a 'Quarter' number (help)
- Sum up the products sold by Store and Quarter (help)
- Add the Targets data
- Join the Targets data with the aggregated Stores data (help)
- Note: this should give you 20 rows of data
- Remove any duplicate fields formed by the Join
- Calculate the Variance between each Store's Quarterly actual sales and the target. Call this field 'Variance to Target' (help)
- Rank the Store's based on the Variance to Target in each quarter (help)
- The greater the variance the better the rank
- Output the data (help)
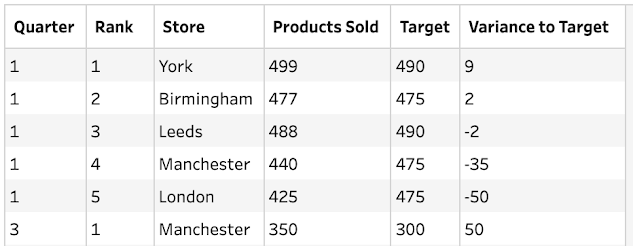
Output
One file:
6 Data Fields:
- Quarter
- Rank
- Store
- Products Sold
- Target
- Variance to Target
20 Rows (21 rows including headers)
You can also post your solution on the Tableau Forum where we have a Preppin' Data community page. Post your solutions and ask questions if you need any help!


