Week 17: Timesheet checks
Challenge by: Pat Lucas (@PatForData)
This challenge came about from a challenge Pat received as his friends and family have begun to learn about his super data preparation skills. Pat has built out a detailed set of requirements so this might be an easier challenge for some.
The Challenge
My employees log their hours daily and are contracted to 8 hours per week so I want to check their average number of hours worked over the last 2 weeks. Also, I allow for 20% of their time (not including Chats) to work on their own special projects, meaning they should be spending at least 80% of their time on Client items of work, so I also want to check that they are sticking to instructions by calculating the % of total hours spent on Client work. The task has three sets of requirements as the stakeholder is quite specific.
Input
One file but three people's data:

Requirements
- Remove the ‘Totals’ Rows
- Pivot Dates to rows and rename fields 'Date' and 'Hours'
- Split the ‘Name, Age, Area of Work’ field into 3 Fields and Rename
- Remove unnecessary fields
- Remove the row where Dan was on Annual Leave and check the data type of the Hours Field.
- Total up the number of hours spent on each area of work for each date by each employee.
- First we are going to work out the avg number of hours per day worked by each employee
- Calculate the total number of hours worked and days worked per person
- Calculate the avg hours and remove unnecessary fields.
- Now we are going to work out what % of their day (not including Chats) was spend on Client work.
- Filter out Work related to Chats.
- Calculate total number of hours spent working on each area for each employee
- Calculate total number of hours spent working on both areas together for each employee
- Join these totals together
- Calculate the % of total and remove unnecessary fields
- Filter the data to just show Client work
- Join to the table with Avg hours to create your final output
Output
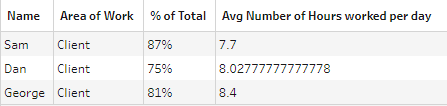
One file:
4 fields:
- Name
- Area of Work
- % of Total
- Avg Number of Hours worked per day
3 rows (4 rows including headers)
You can download the full outputs here.
After you finish the challenge make sure to fill in the participation tracker, then share your solution on Twitter using #PreppinData and tagging @Datajedininja, @JennyMartinDS14 & @TomProwse1
You can also post your solution on the Tableau Forum where we have a Preppin' Data community page. Post your solutions and ask questions if you need any help!


