Challenge by: Carl Allchin
Every now and then at Preppin' HQ when we are not busy running Chin & Beard Suds Co or Prep Air, talking about Jenny's obsession with Pokemon, we cook up a fiendish challenge. Occasionally those challenges make it into the weekly challenge. This is one of those times. Good luck!
Challenge
We want you to calculate the results of the NBA draft lottery for 2021 (yes the lottery actually happened on 22nd June but I only thought of the challenge on that day and Jenny had some Pokemon challenges already booked in). The flow should be able to re-run to recalculate the results as if the lottery is done again with each run.
The lottery gives teams the chance to land the best picks in the NBA draft. The NBA draft is where teams take it in turns to allocate the best young international and college players.
The lottery odds are based on where you finish the season. The team with the worst record of wins and loses gets the best chance to earn the first pick. Once that team is selected, they are no longer in the lottery for other picks.
Only the first 4 draft picks are chosen in the lottery. After the first four selections are made, the remaining teams are allocated their draft picks based on what position they finished in the league (in worst to best order).
Input
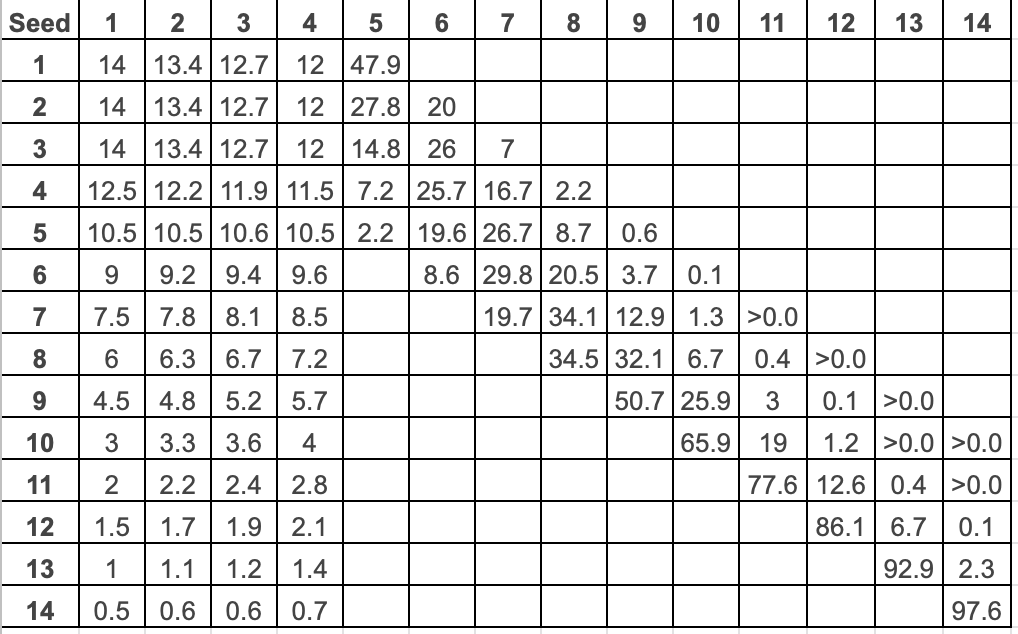
The lottery odds are one of the inputs for the challenge this week but I'll let you format them how you want to with your Prep tool. The values in the table are for each team to land each spot.
For example, for the 1st pick (column 1), each of the first 3 seeds have an even 14% chance on winning the first pick. The 14th team only has a 0.5% chance of winning the first pick.
For the 2nd pick (column 2), the 13 teams who haven't won the 1st pick are then eligible to win the 2nd pick. The column has the relevant % chance of winning the pick.
By the 5th pick, if the 1st seed hasn't successfully gained any of the previous picks, they would receive the 5th pick so for this challenge you don't need to worry about the odds below the 4th pick.
I've also added an additional two inputs to help formulate your answer:
A scaffold that runs from 1 to 1000
A list of the seeds 1 to 14. Houston has the best odds of landing the best draft pick, Golden State the worst.
Requirements
This is a challenge where I'm intrigued to see what you create as much as whether you can meet the challenge.
The overall objective is to:
- Create a workflow that will allocate the draft picks in a random manner based on the odds for each team
- The random function in Tableau Prep is random()
- The workflow should allocate each of the first 4 picks based on the lottery odds and then allocate all teams that didn't receive a slot to the remaining places in order
Output
Your results are likely to differ as your lottery calculator should produce a different order for the first 4 picks than mine.
In my draft lottery, Oklahoma won the draft with my beloved San Antonio staying where they are:
Updated Image and output 8/7/21 due to a couple of missing rows
Share your draft results to see who's fans you would have made very happy!
You should have 3 data fields:
14 rows of data (15 including headers)
Here's our
full output for comparison. Remember we don't care about the order of the columns or rows as Tableau Desktop will import them in whatever order they come in!
You can also post your solution on the
Tableau Forum where we have a Preppin' Data community page. Post your solutions and ask questions if you need any help!