2021: Week 33 Excelling at adding one more row
Challenge by: Carl Allchin
If you've spent as long as I have in the data world, you will inevitably have had moments when your sophisticated tools are actually a lot harder to solve a challenge with than Excel. The people you work with are likely to describe challenges to you in Excel terms and expect your solutions to be able to follow the same process as their logic. It's not always that easy though.
Last week when working with some client data (I've converted this to an Allchains example), my team was challenged to look at Orders captured in a weekly snapshot that was then exported into Excel.
Each week the file would show any order that was still opened that hadn't been fulfilled (ie delivered to the customer). The challenge is to classify when an order is new (the first report it has appeared in), unfulfilled (when it appears in any subsequent reports) or completed (the week after the order last appears in a report). But what if we needed to know whether the order was fulfilled and when?
In Excel, we'd stack of those rows of data on top of each other and just INSERT an extra row for each order after the last time it appears in a weekly snapshot. We don't have that ability to right-click and add the additional row in Prep so we need to think of some alternate logic.
Input
Requirements
- Input the data
- Create one complete data set
- Use the Table Names field to create the Reporting Date
- Find the Minimum and Maximum date where an order appeared in the reports
- Add one week on to the maximum date to show when an order was fulfilled by
- Apply this logic:
- The first time an order appears it should be classified as a 'New Order'
- The week after the last time an order appears in a report (the maximum date) is when the order is classed as 'Fulfilled'
- Any week between 'New Order' and 'Fulfilled' status is classed as an 'Unfulfilled Order'
- Pull of the data sets together
- Remove any unnecessary fields
- Output the data
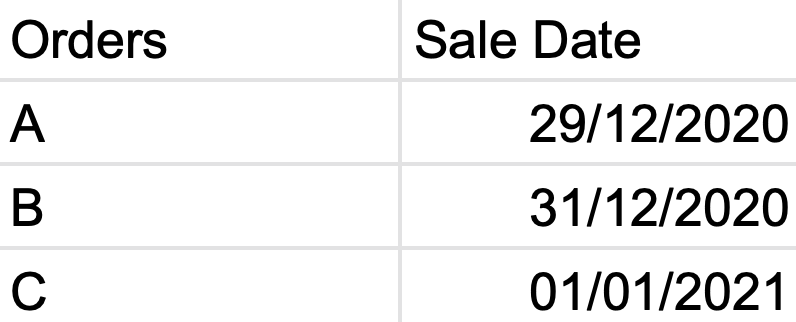
Output

- Order status
- Orders
- Sales Date
- Reporting Date


